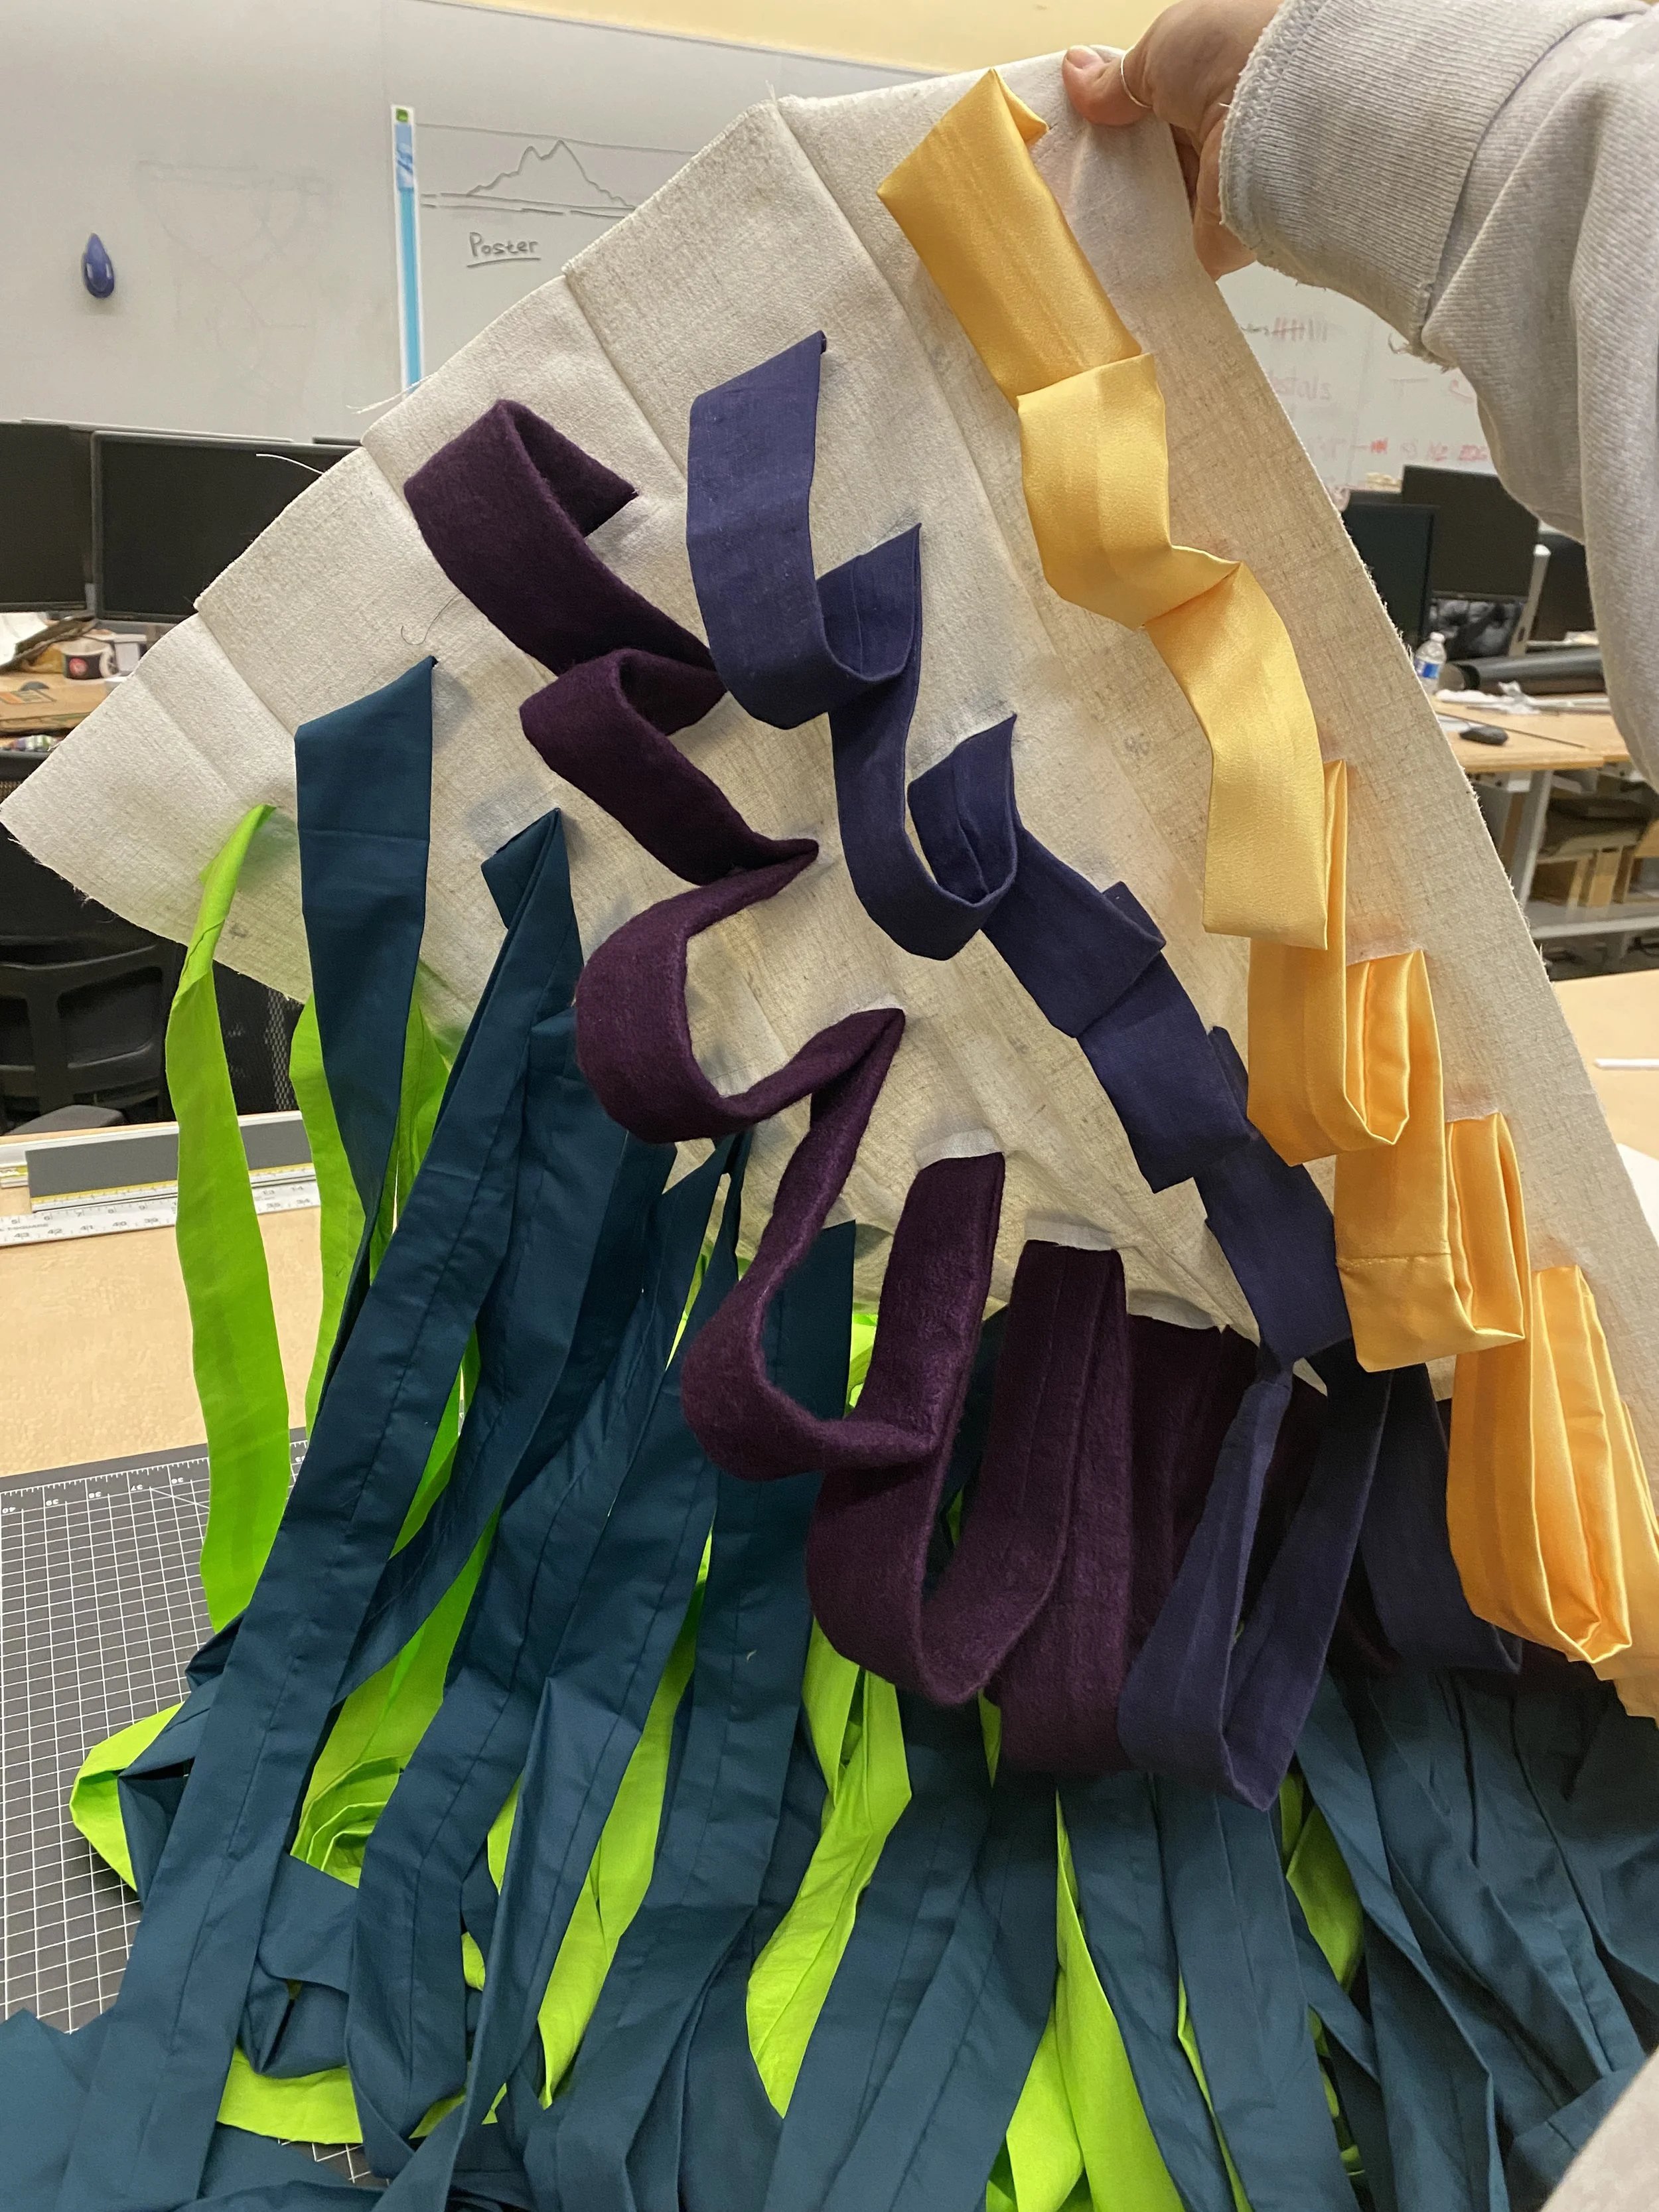
Threads of Time
Data visualization installation, 2023
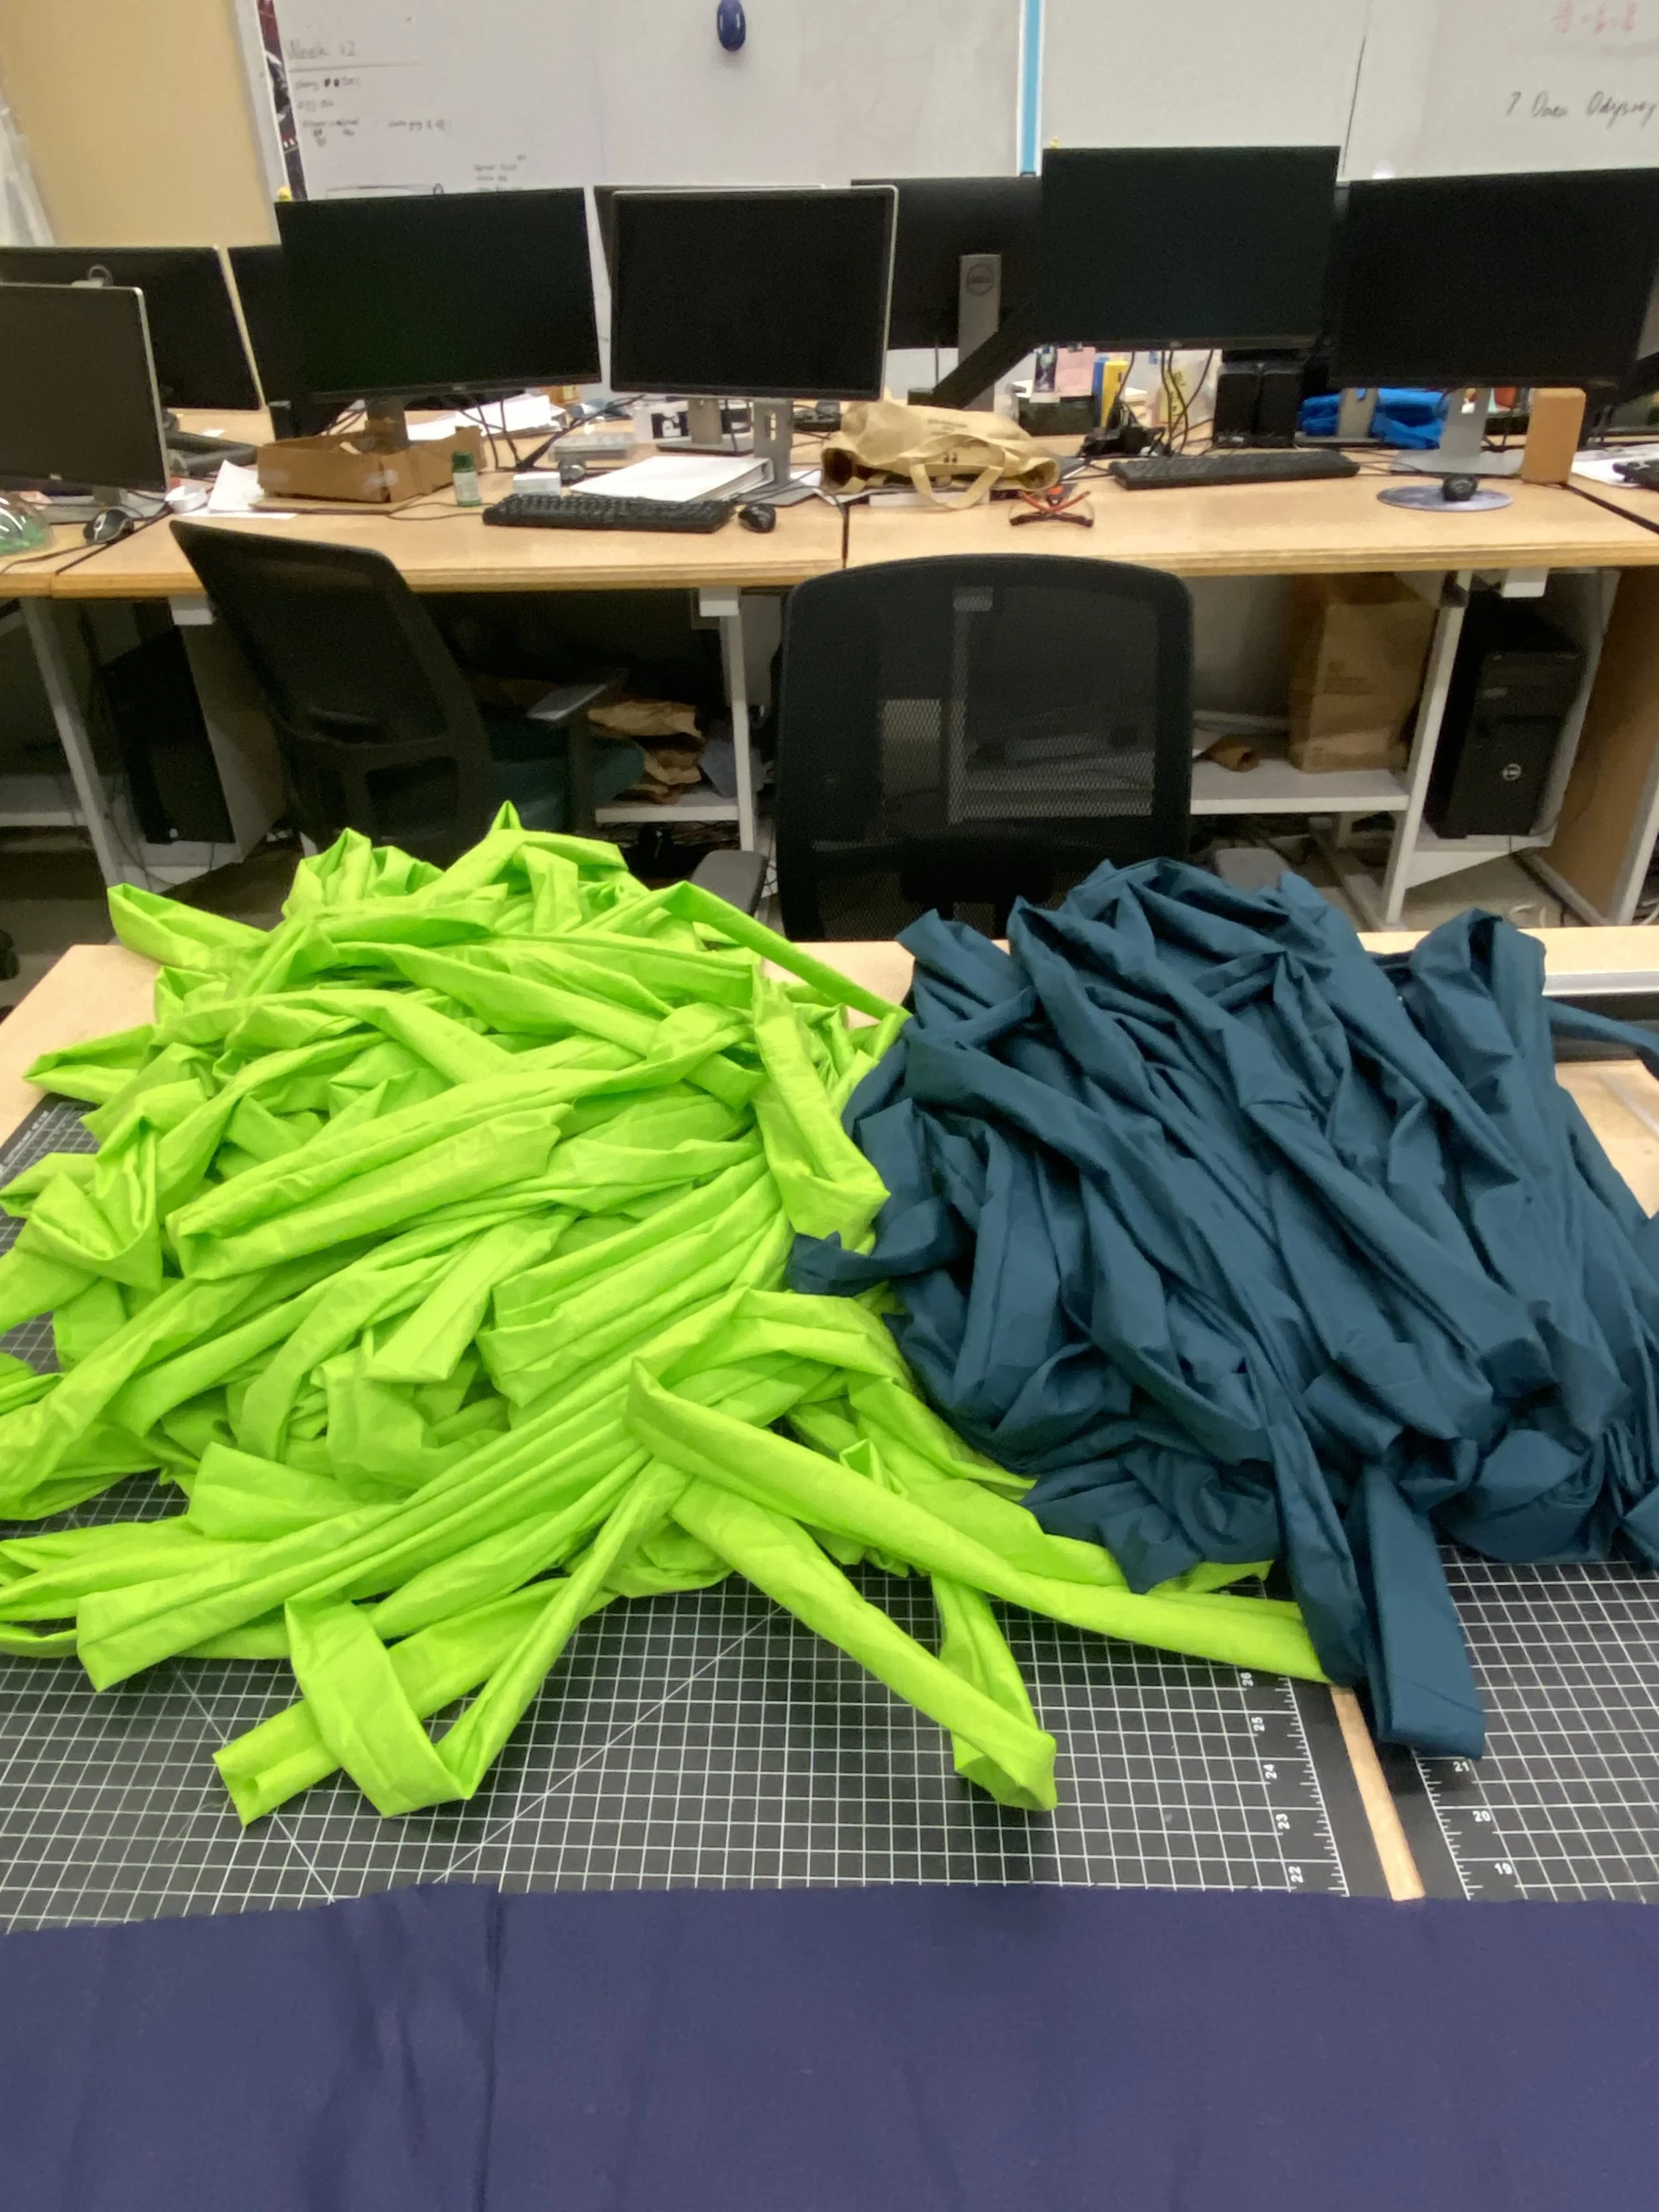
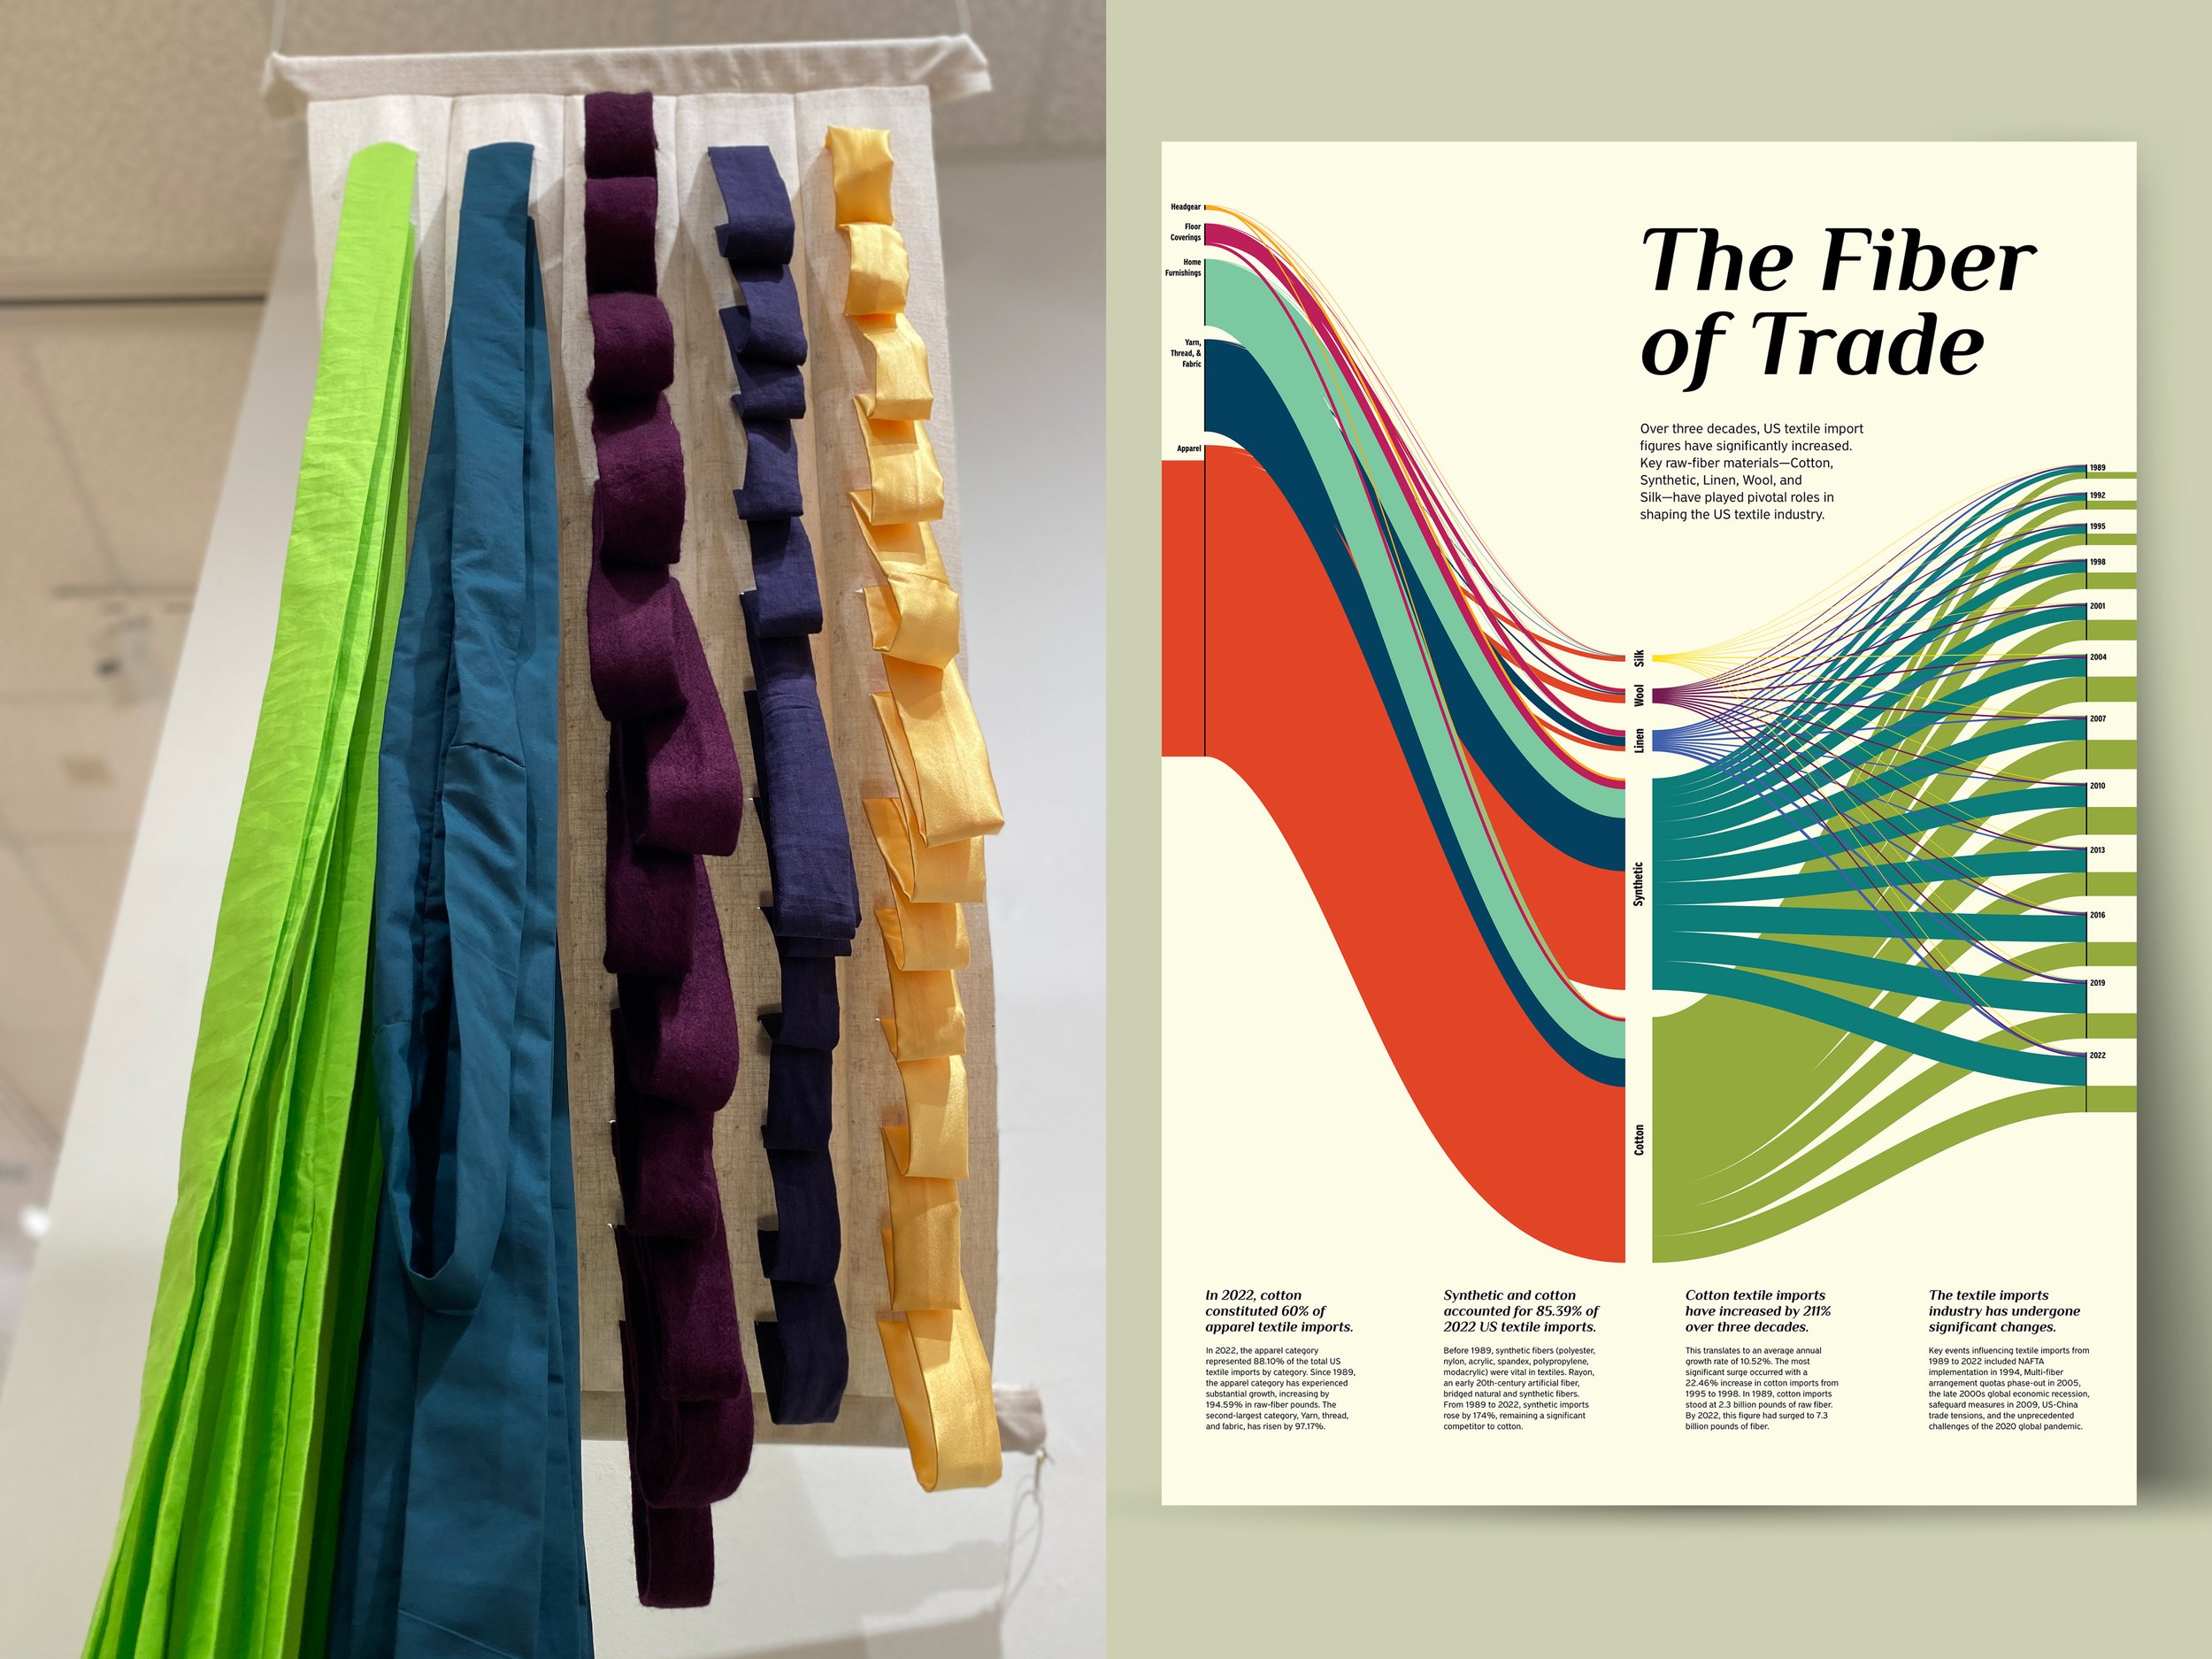
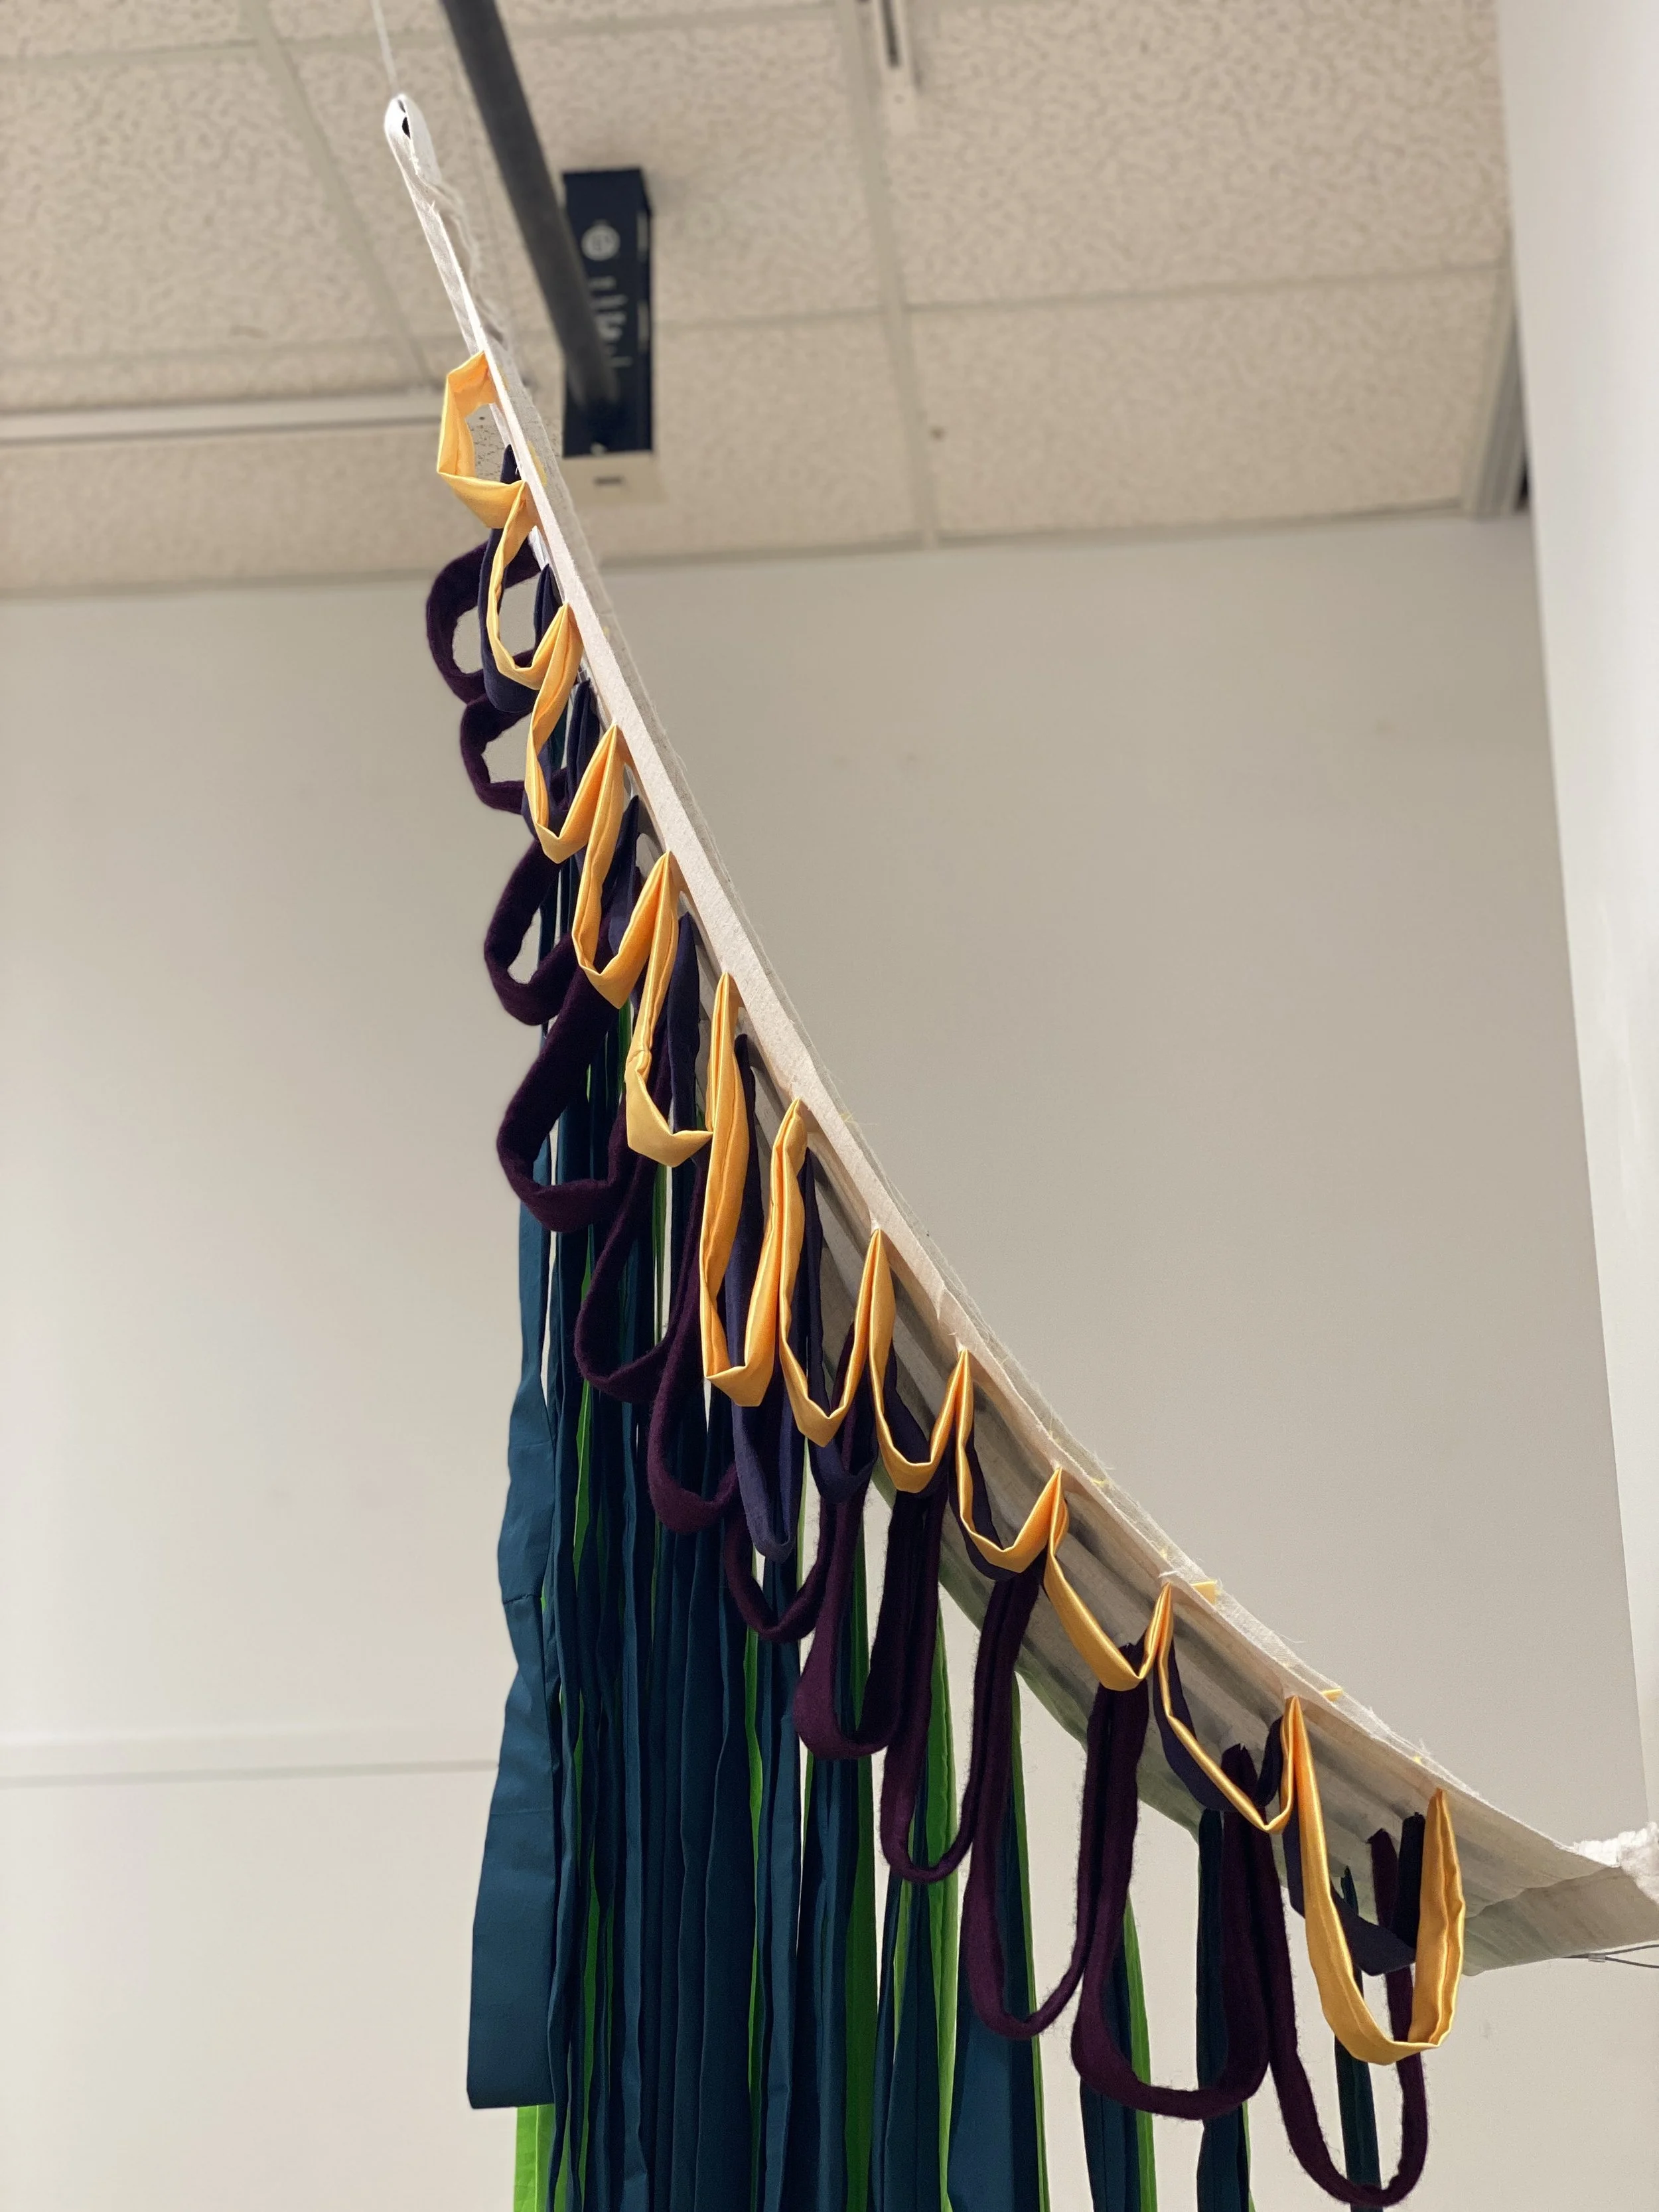
This tactile installation, a fabric sculpture, represents the apparel data of US Textile Imports from 1989 to 2022. The sculpture highlights the significant disparity among the top five materials used in apparel, with cotton and synthetic fibers dominating the landscape of fiber imports to the United States. Accompanying the sculpture, a poster presents US Textile Import figures every three years over the same period. It compares the top five import categories—Apparel, Yarn, Thread & Fabric, Home Furnishings, Floor Coverings, and Headgear—alongside the top five imported raw materials: Cotton, Synthetic, Linen, Wool, and Silk. The visual emphasizes the connections between these categories and materials, showcasing significant increases in imports over time.
Source: USDA, Economic Research Service using data compiled from reports by the U.S. Department of Commerce, Bureau of the Census. https://www.ers.usda.gov/data-products/cotton-wool-and-textile-data/raw-fiber-equivalents-of-u-s-textile-trade-data / (Dataset Table 1: US Textile Imports, by fiber)
Analyzing the data behind the poster and fabric sculpture, this video explores the parallels between U.S. textile imports and the visual representation of material disparities.
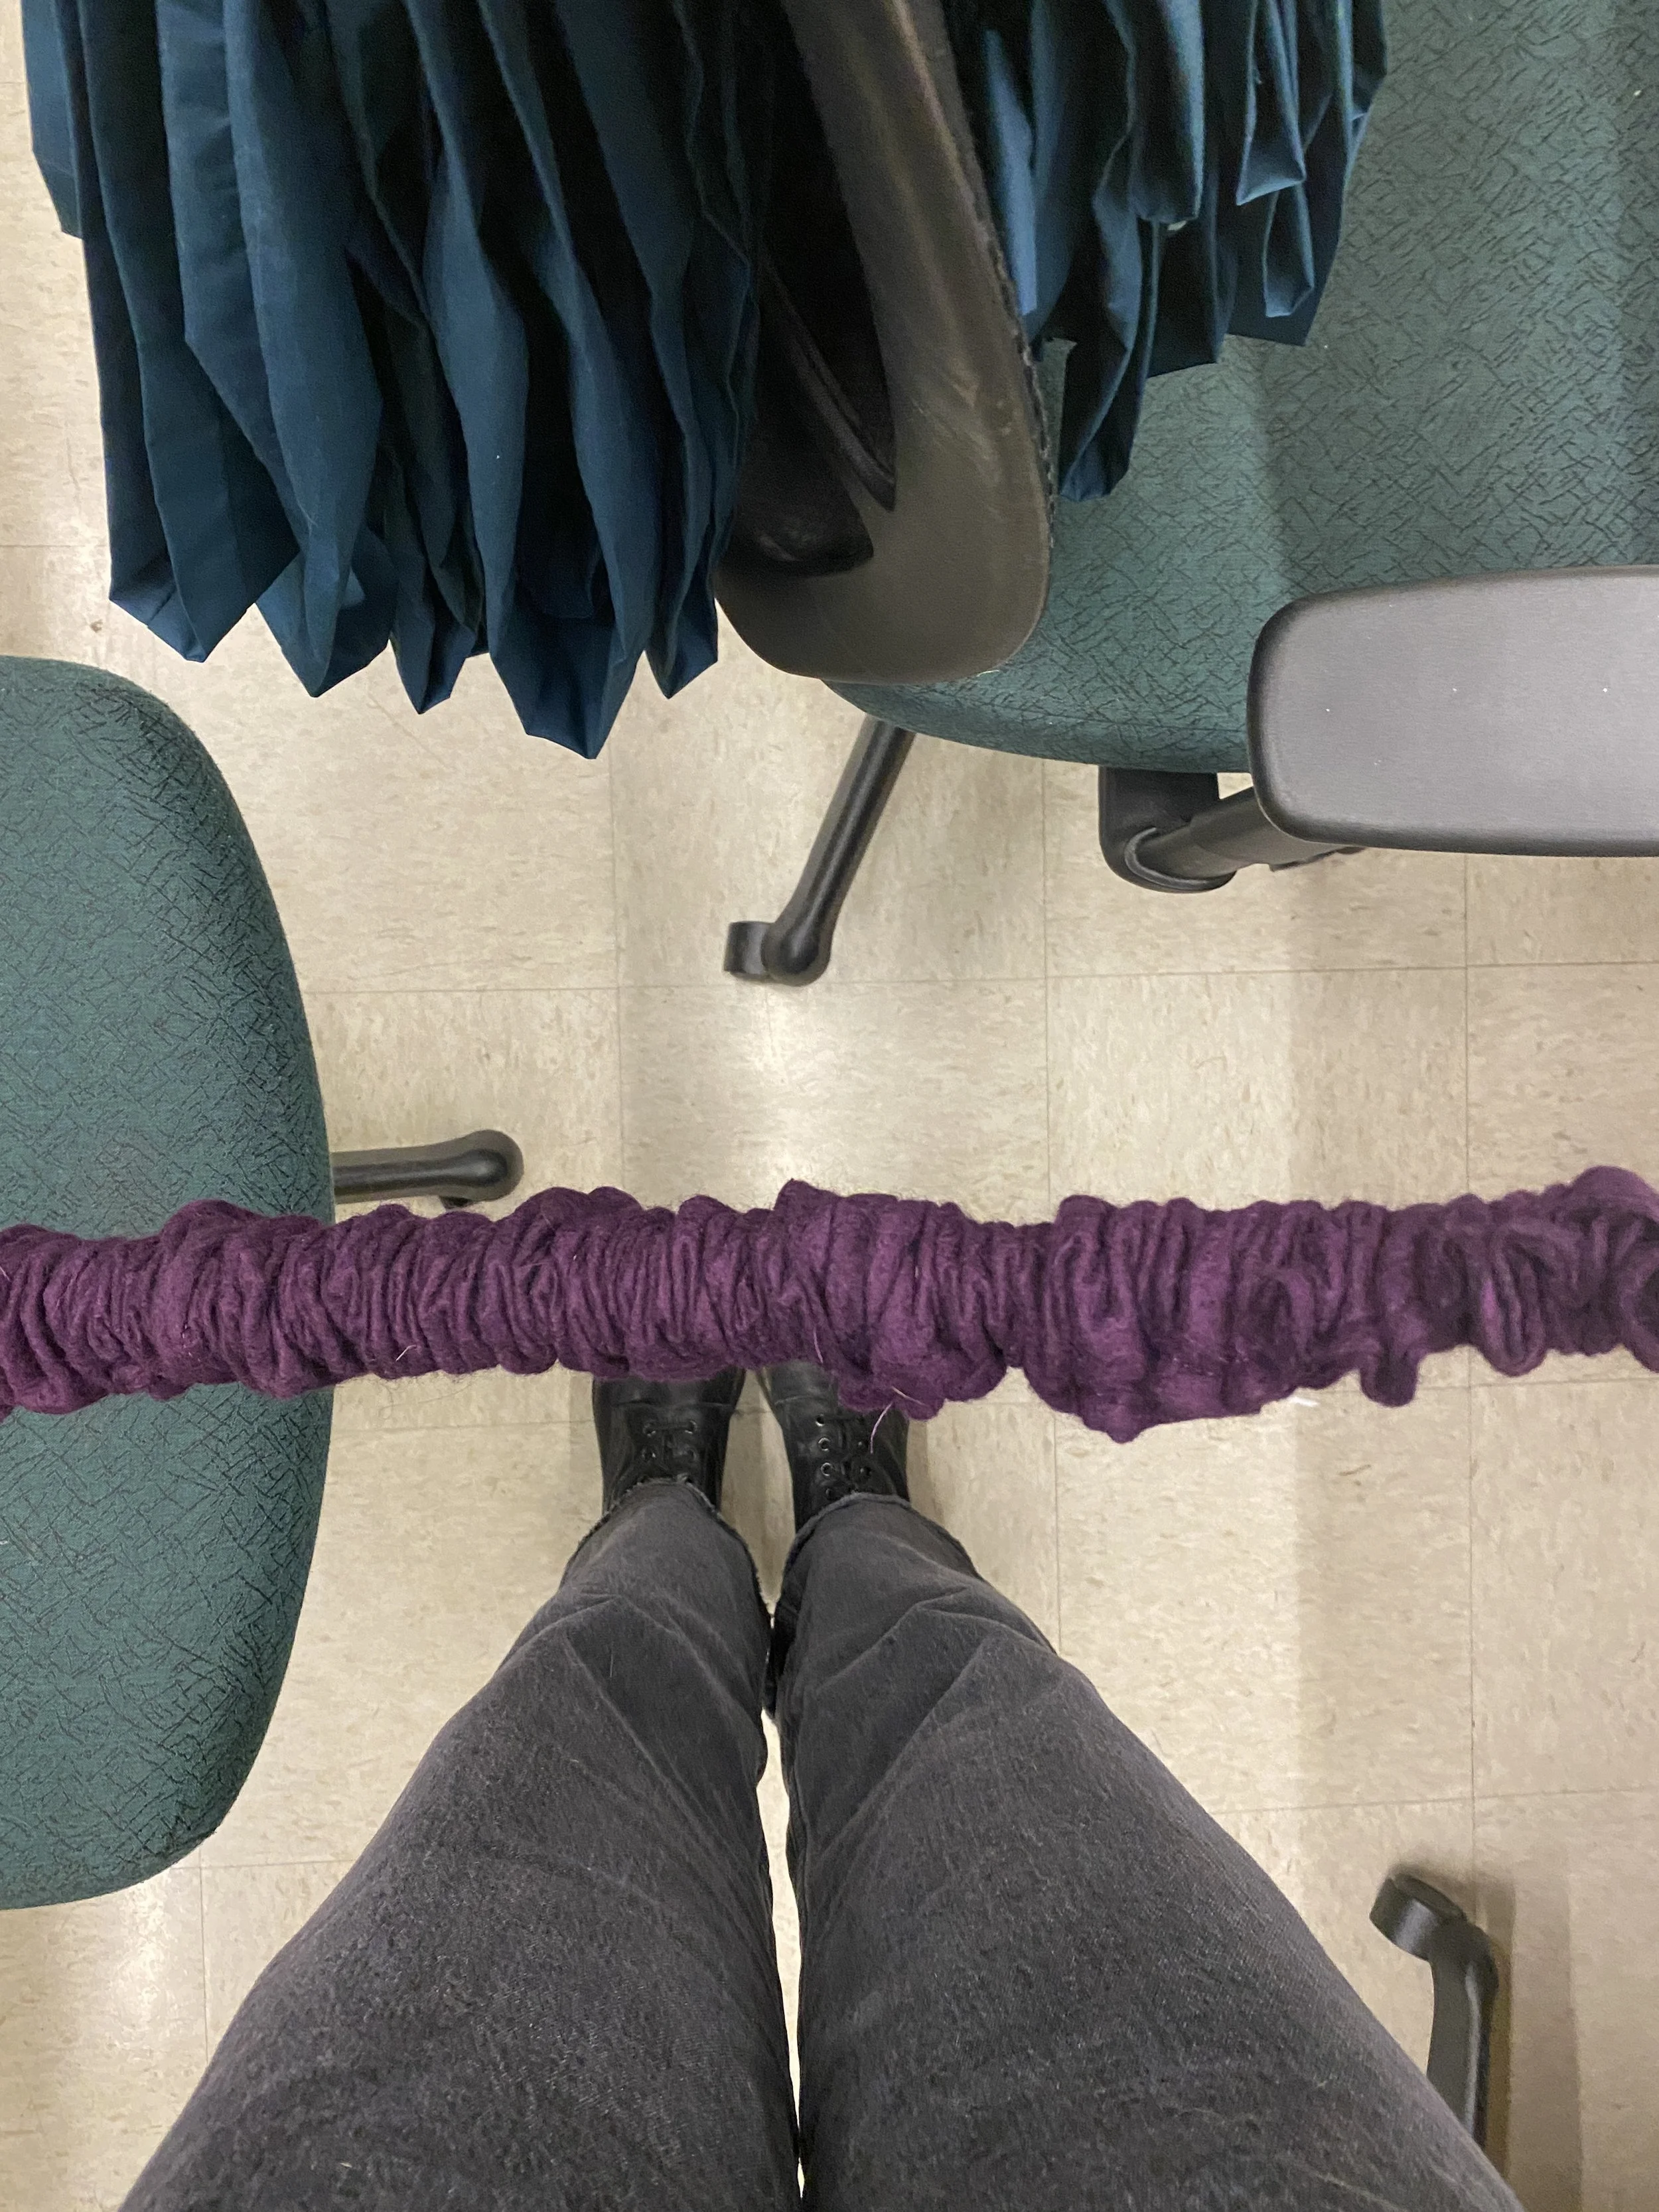
Installation Documentation / Audience Engagement -


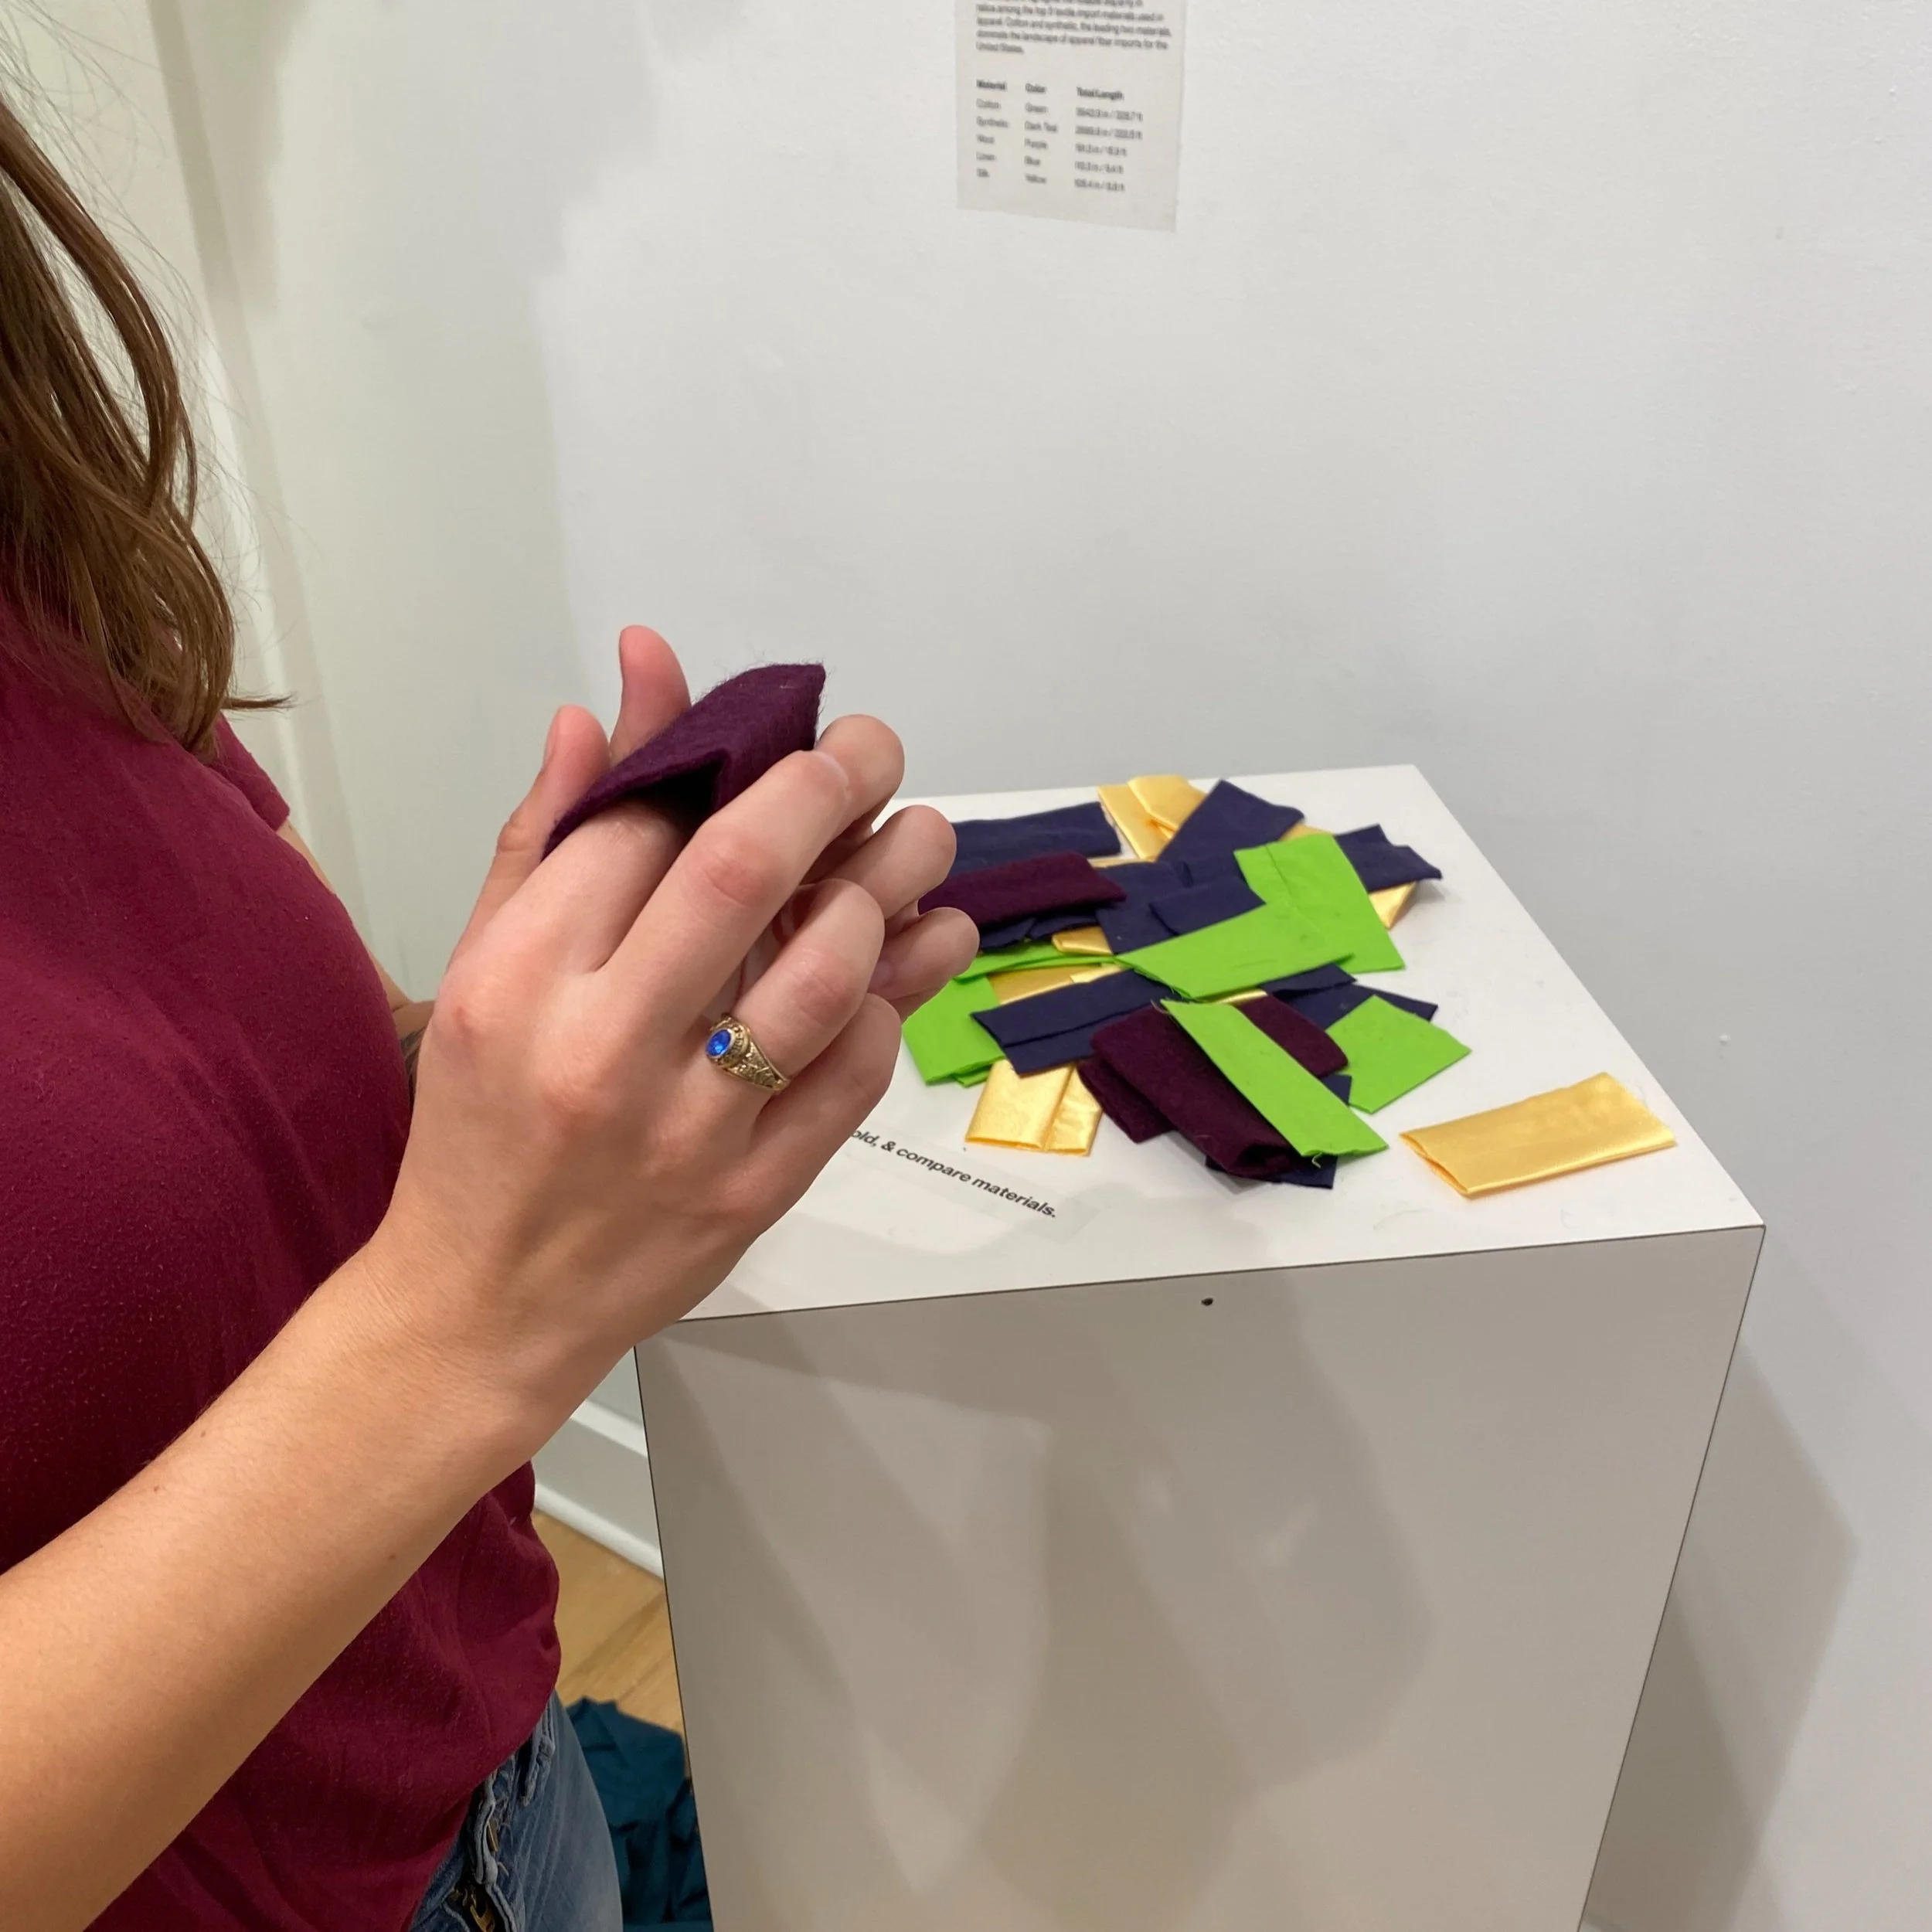
Interactive Engagement: Tactile Exploration of Textile Data
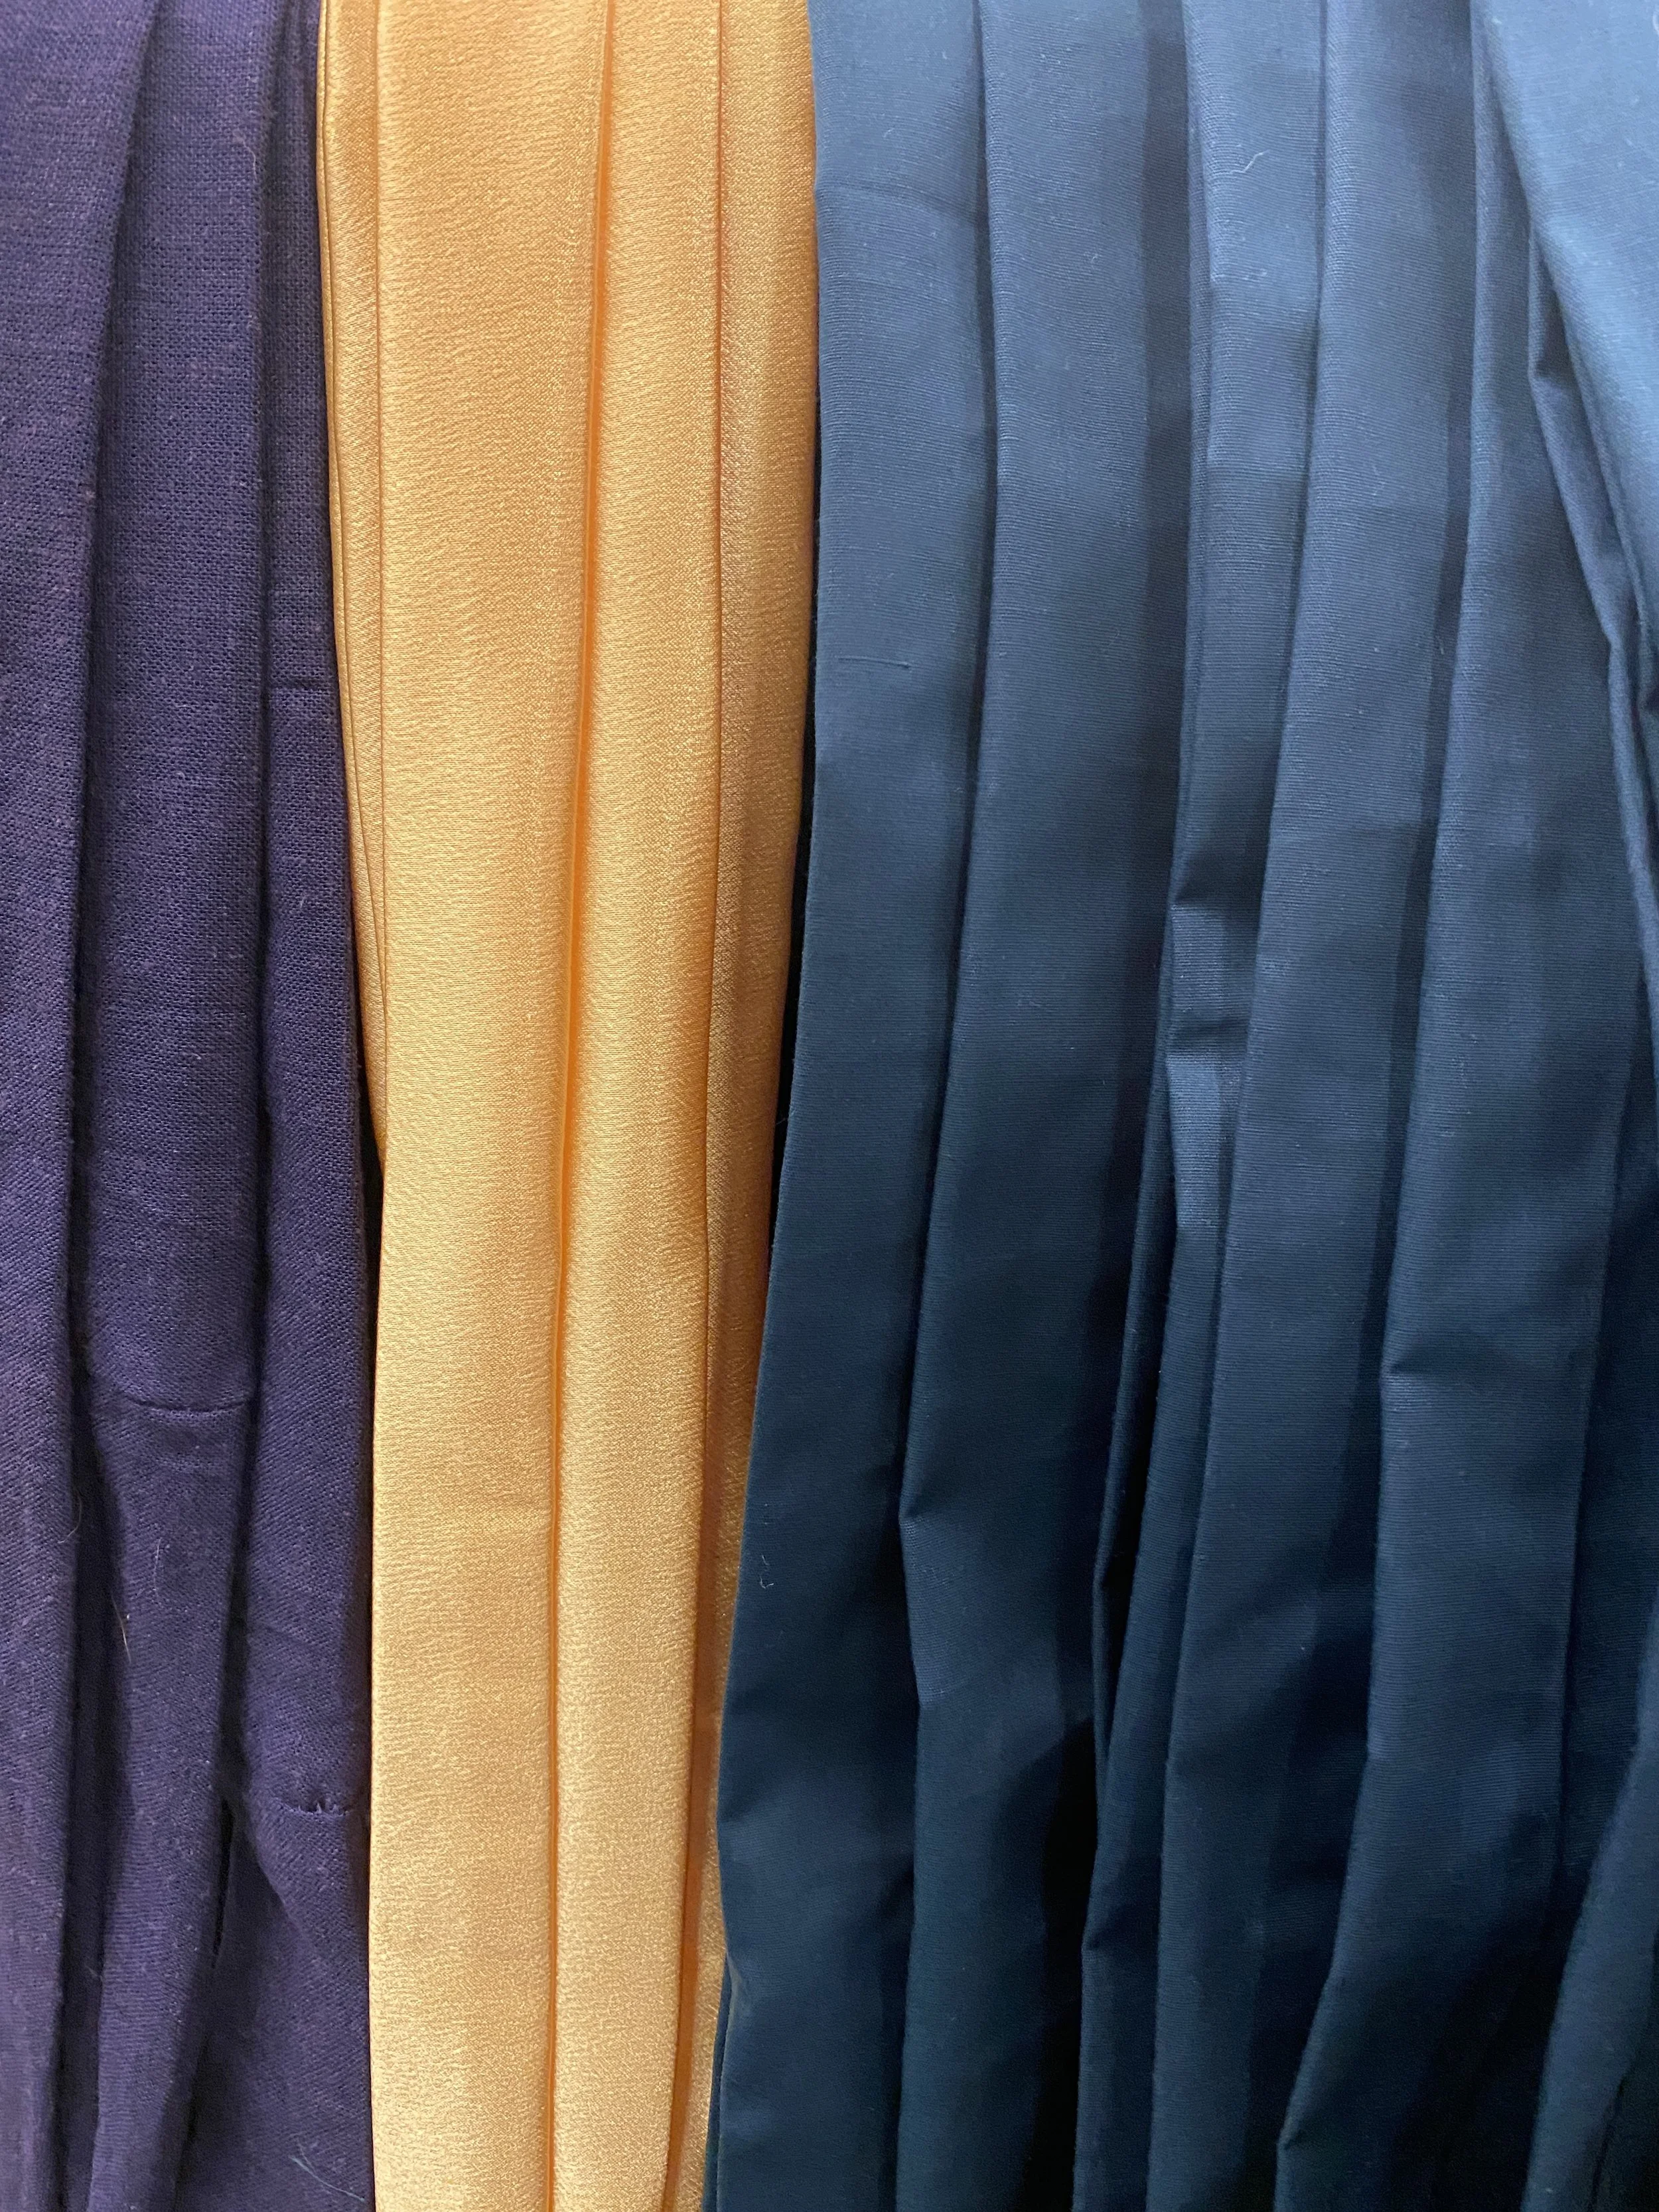
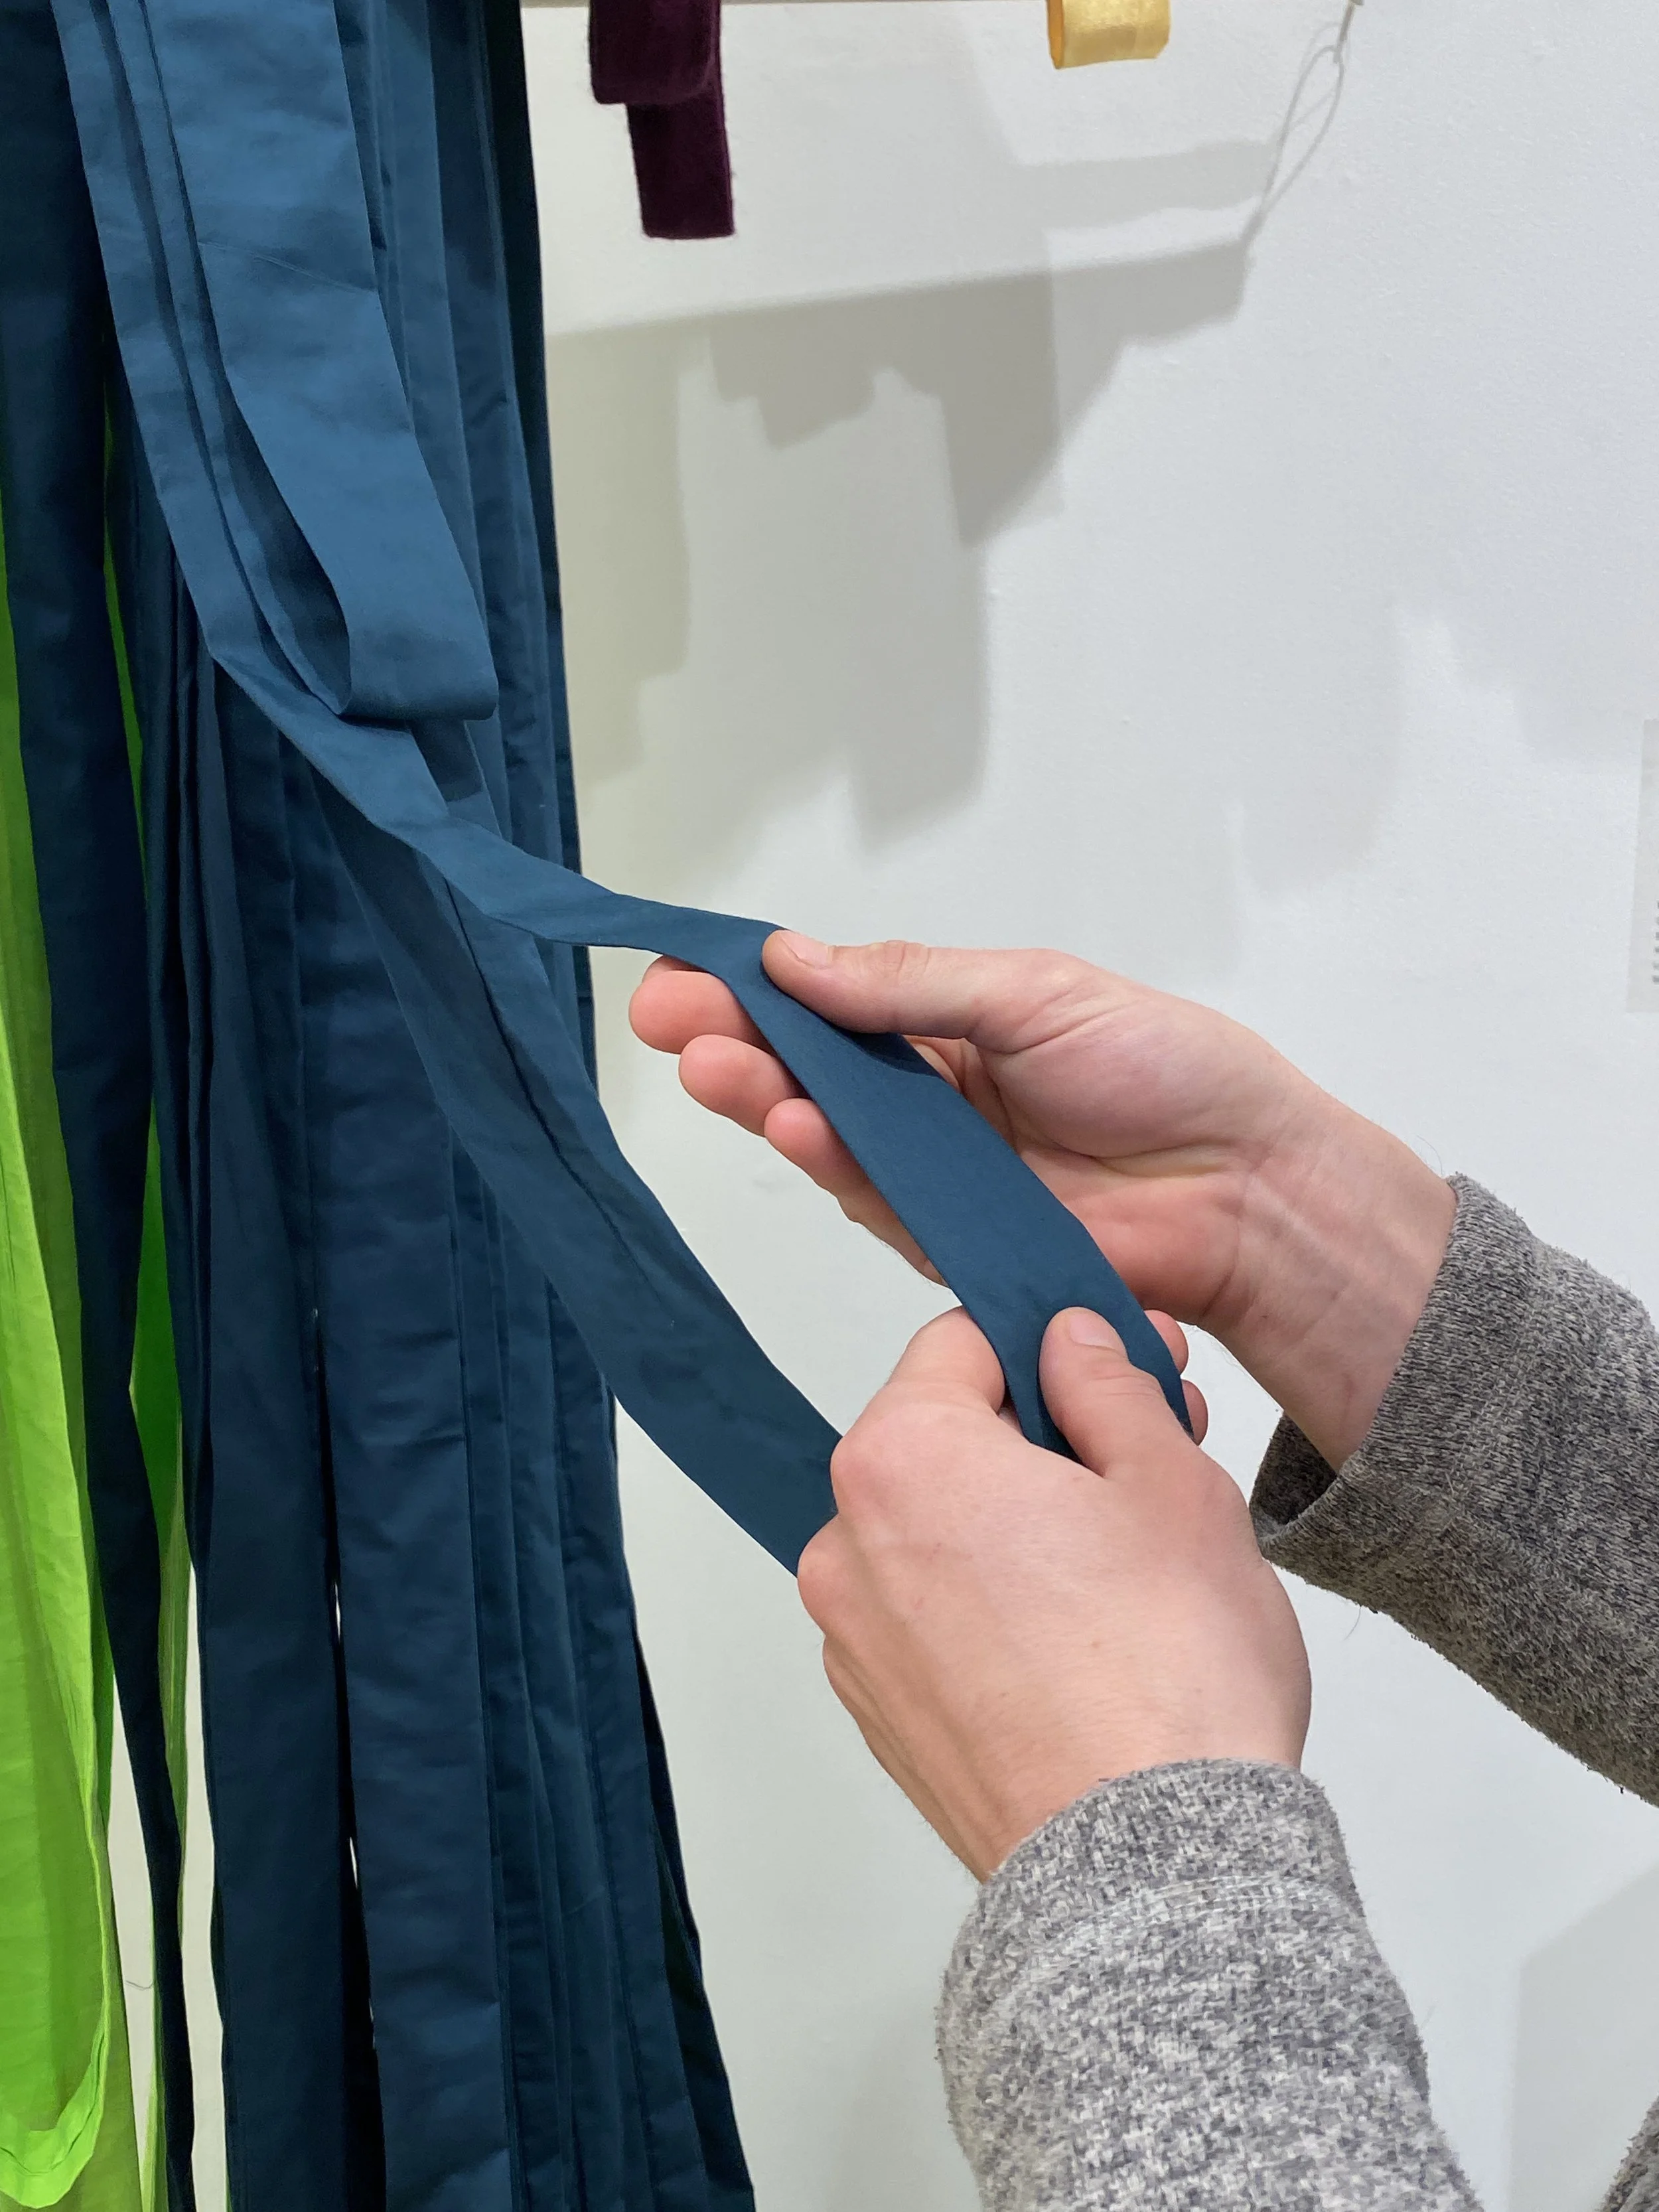
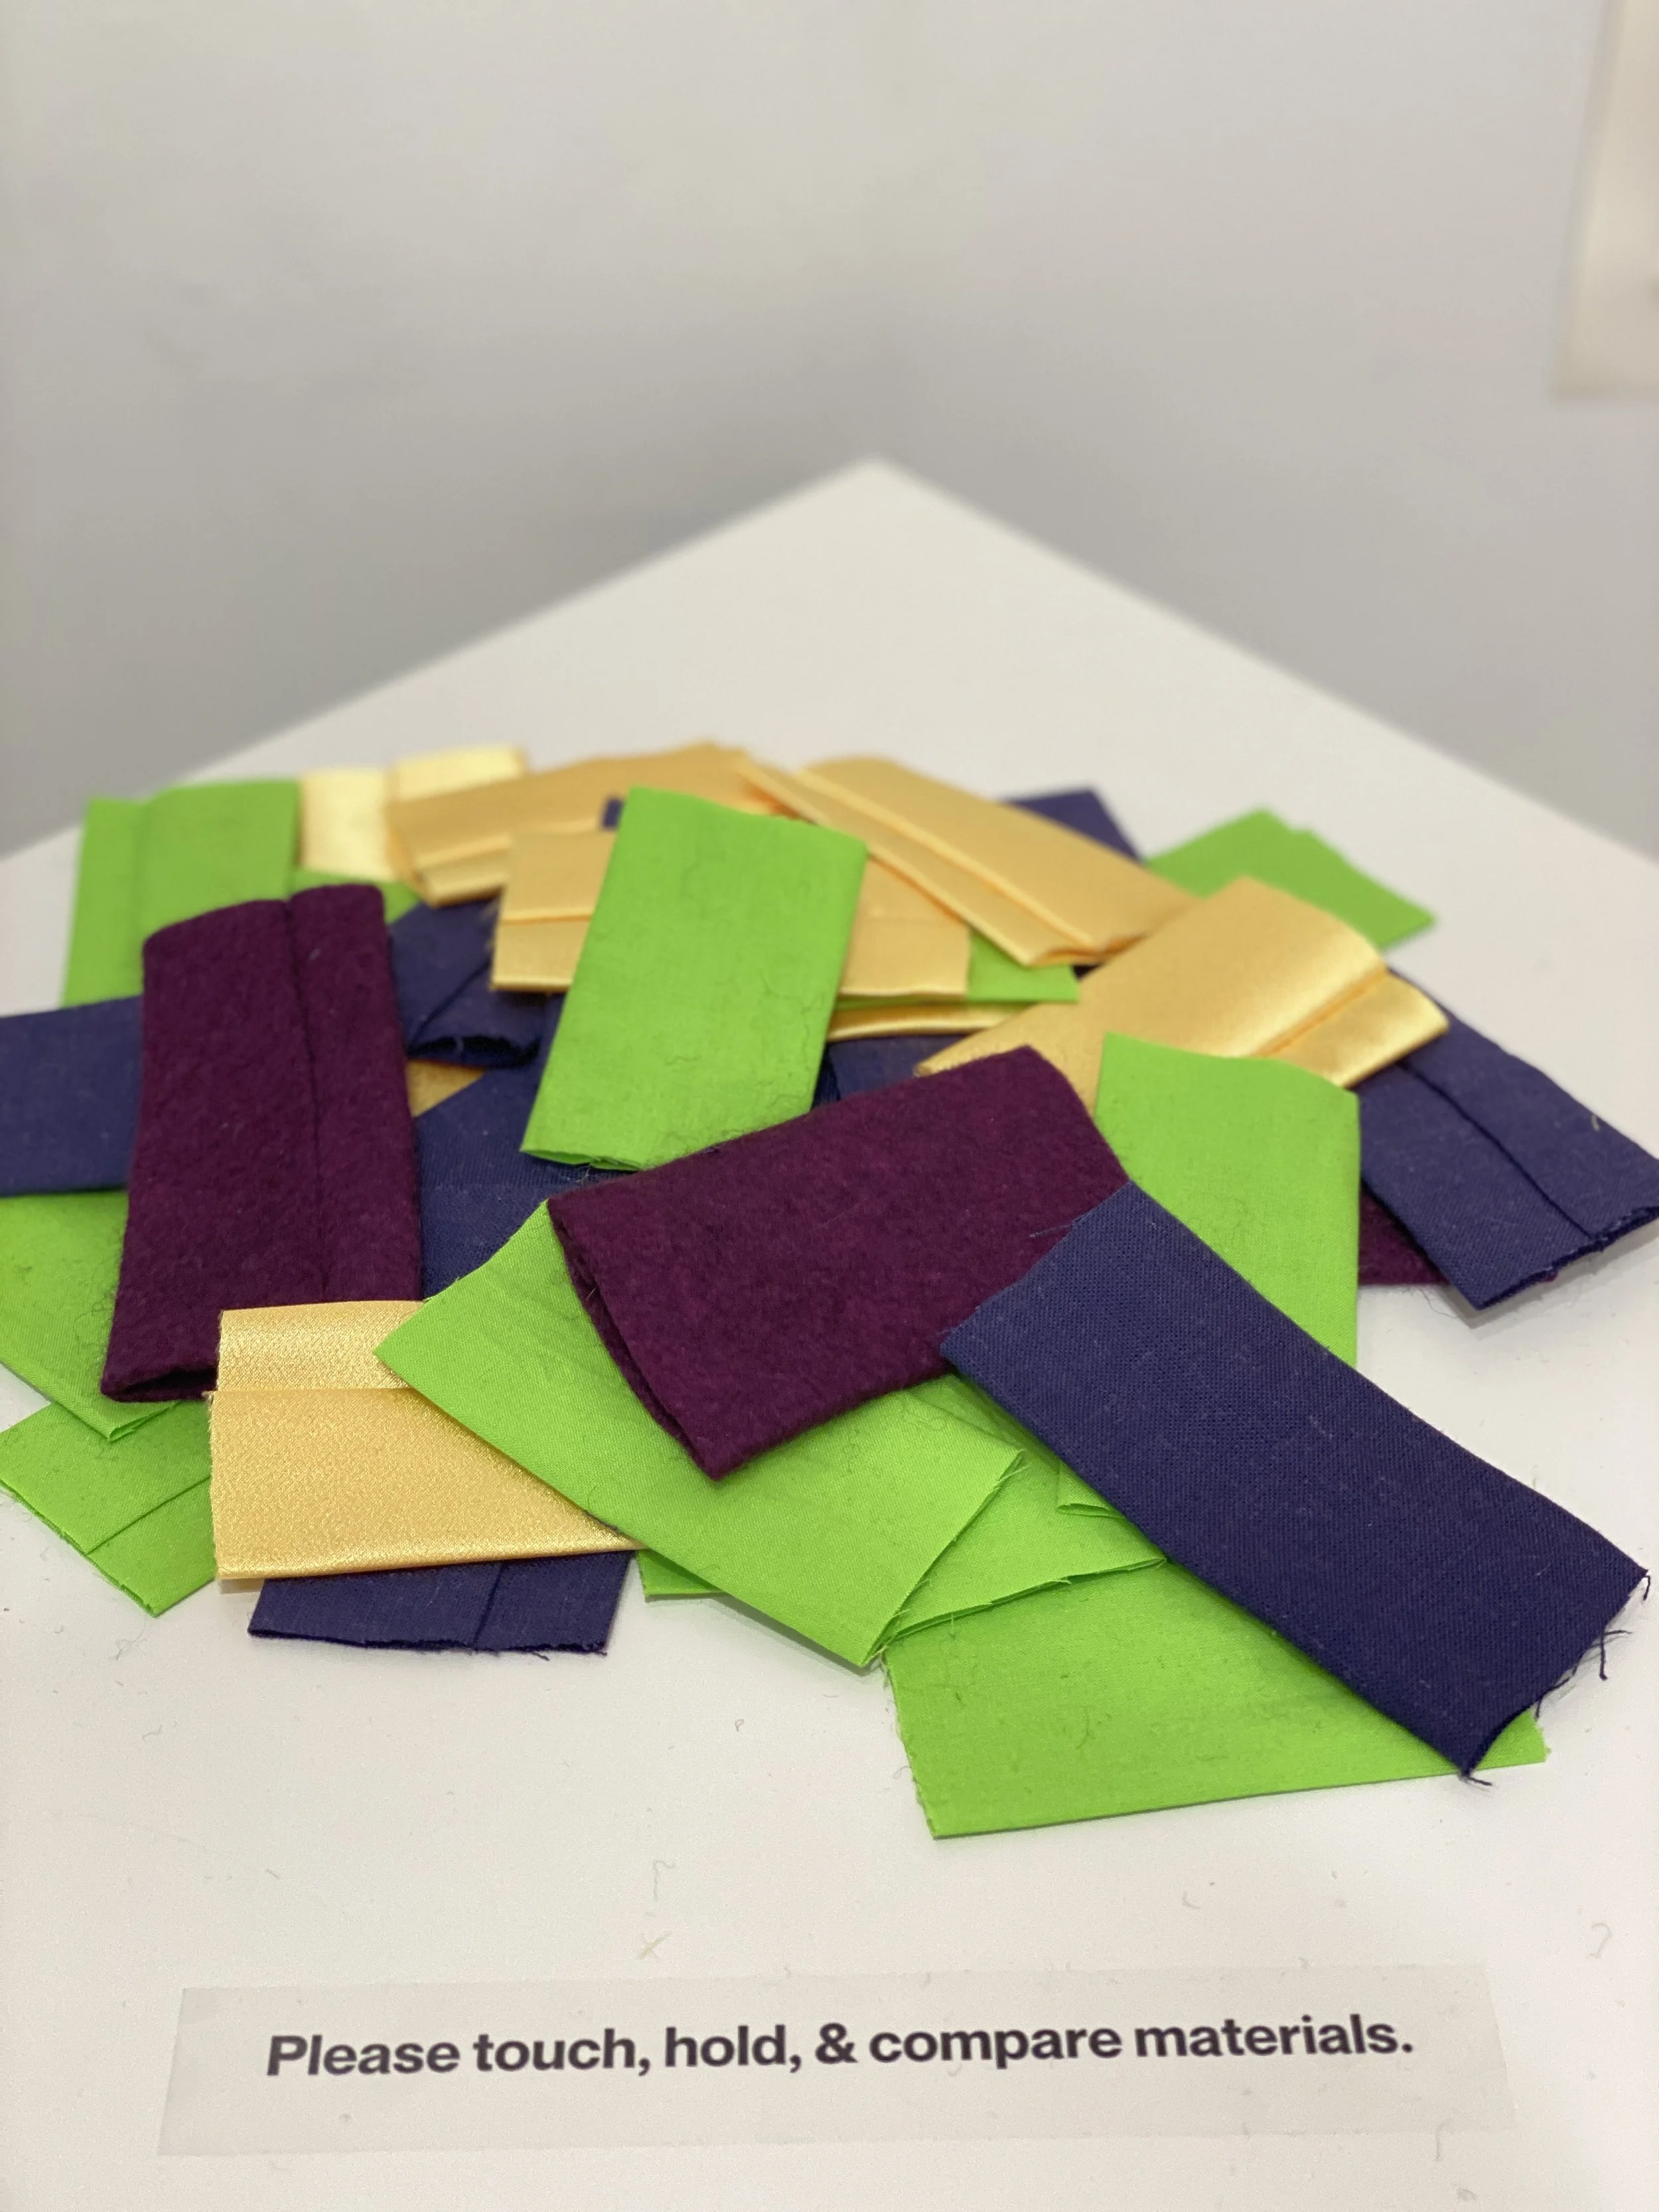
The fabric sculpture invited visitors to engage with the apparel data of US Textile Imports (1989-2022) through tactile exploration. By interacting with the materials, participants were encouraged to compare and feel the distinct textures representing the top five import materials: cotton, synthetic, linen, wool, and silk. The installation brought the data to life, making the disparities in fiber imports tangible for the audience.
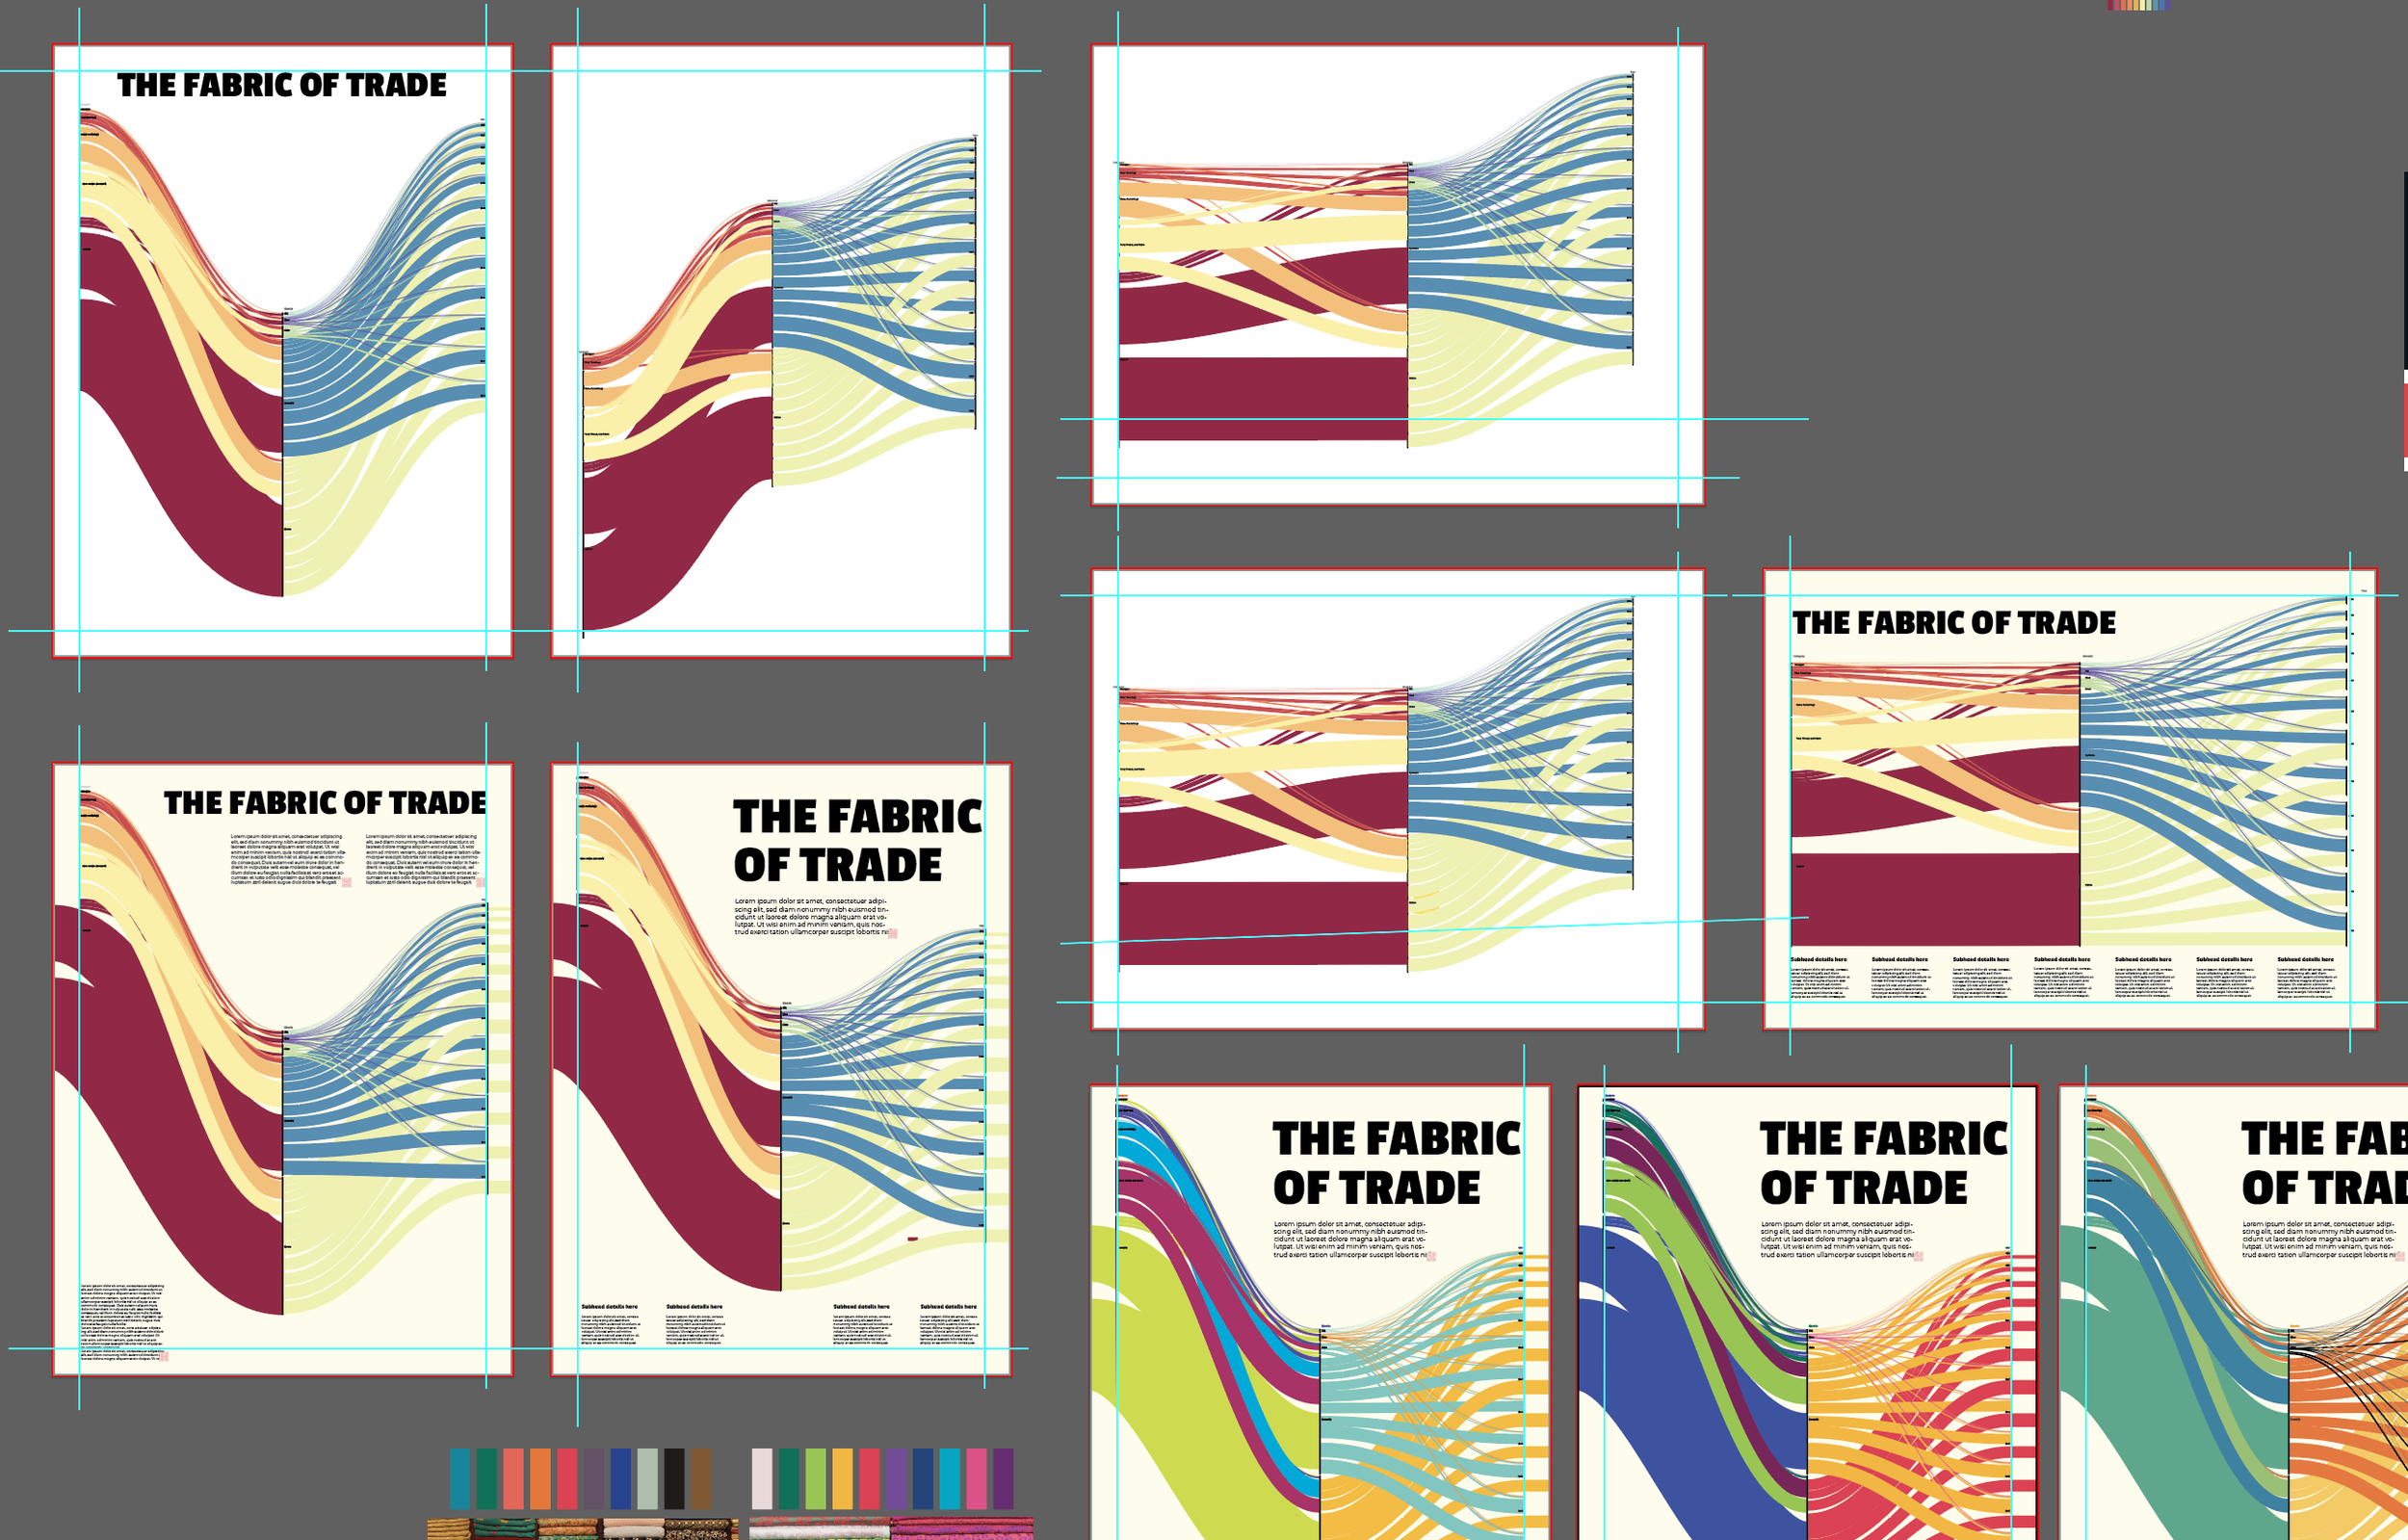
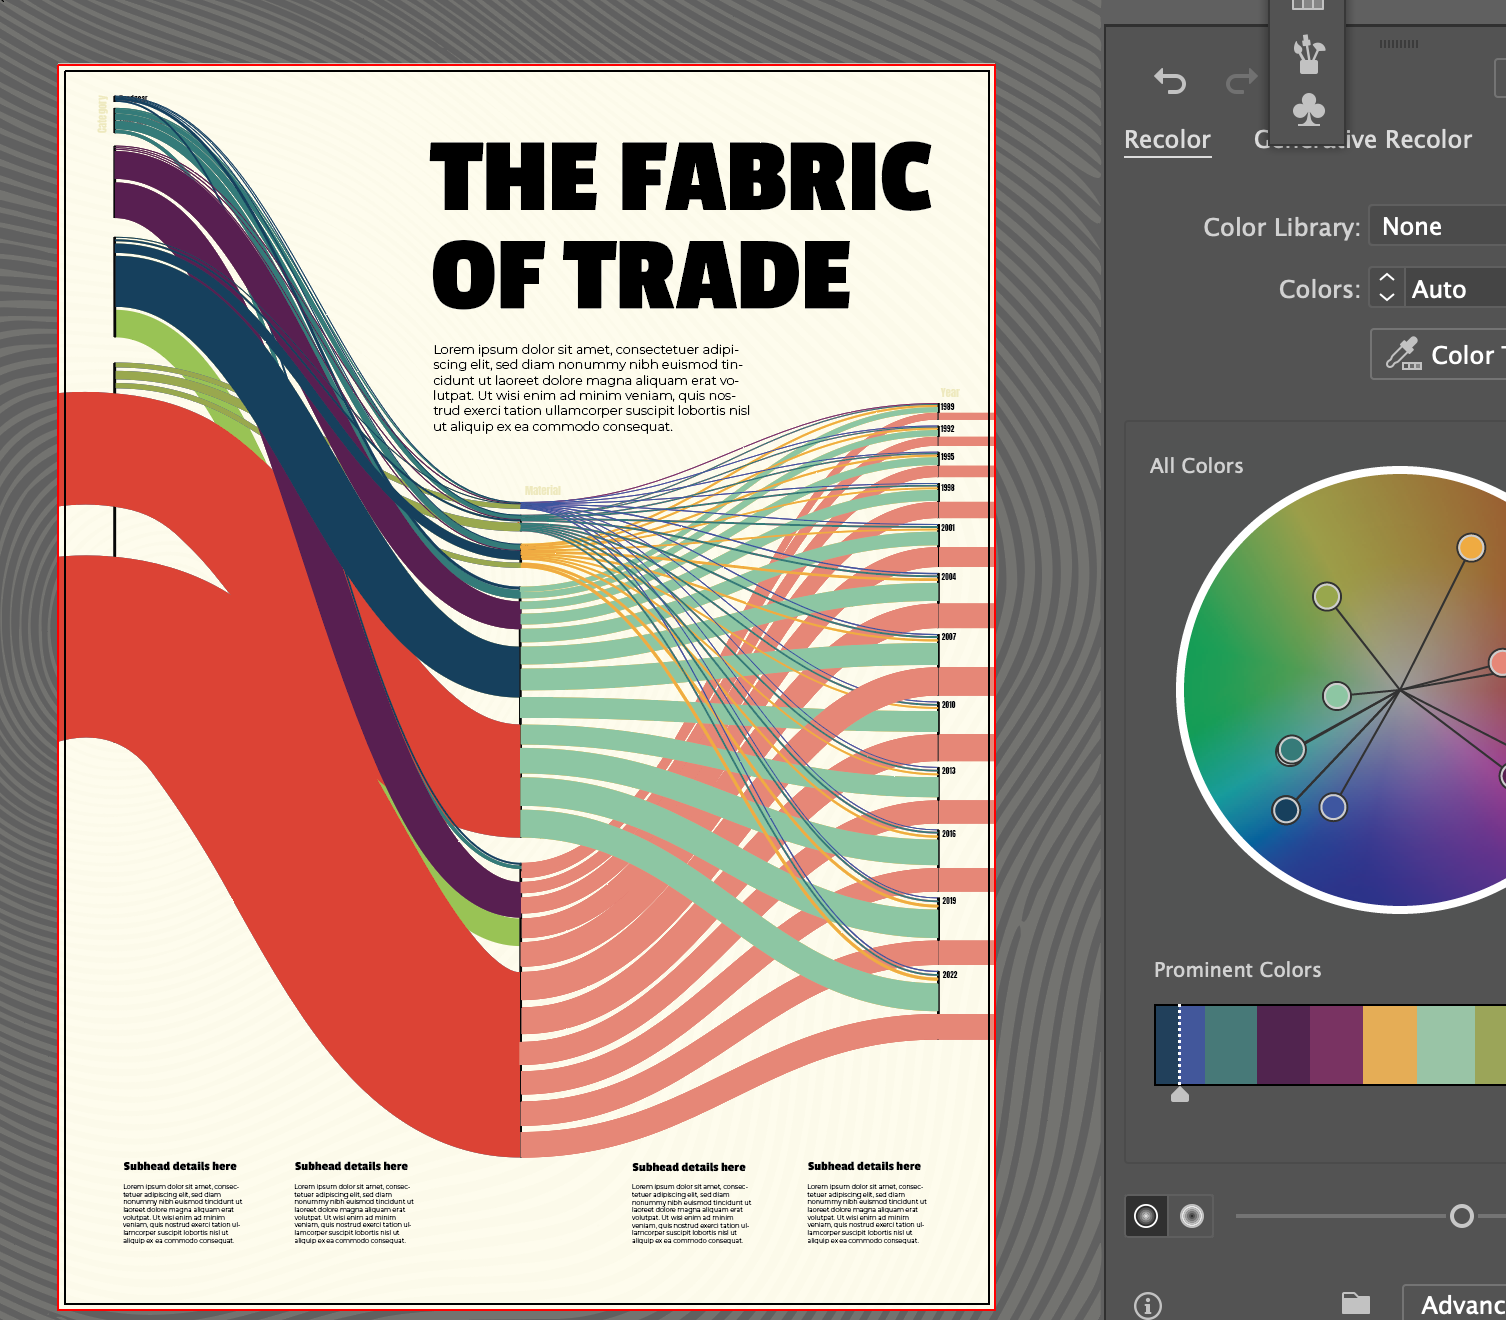
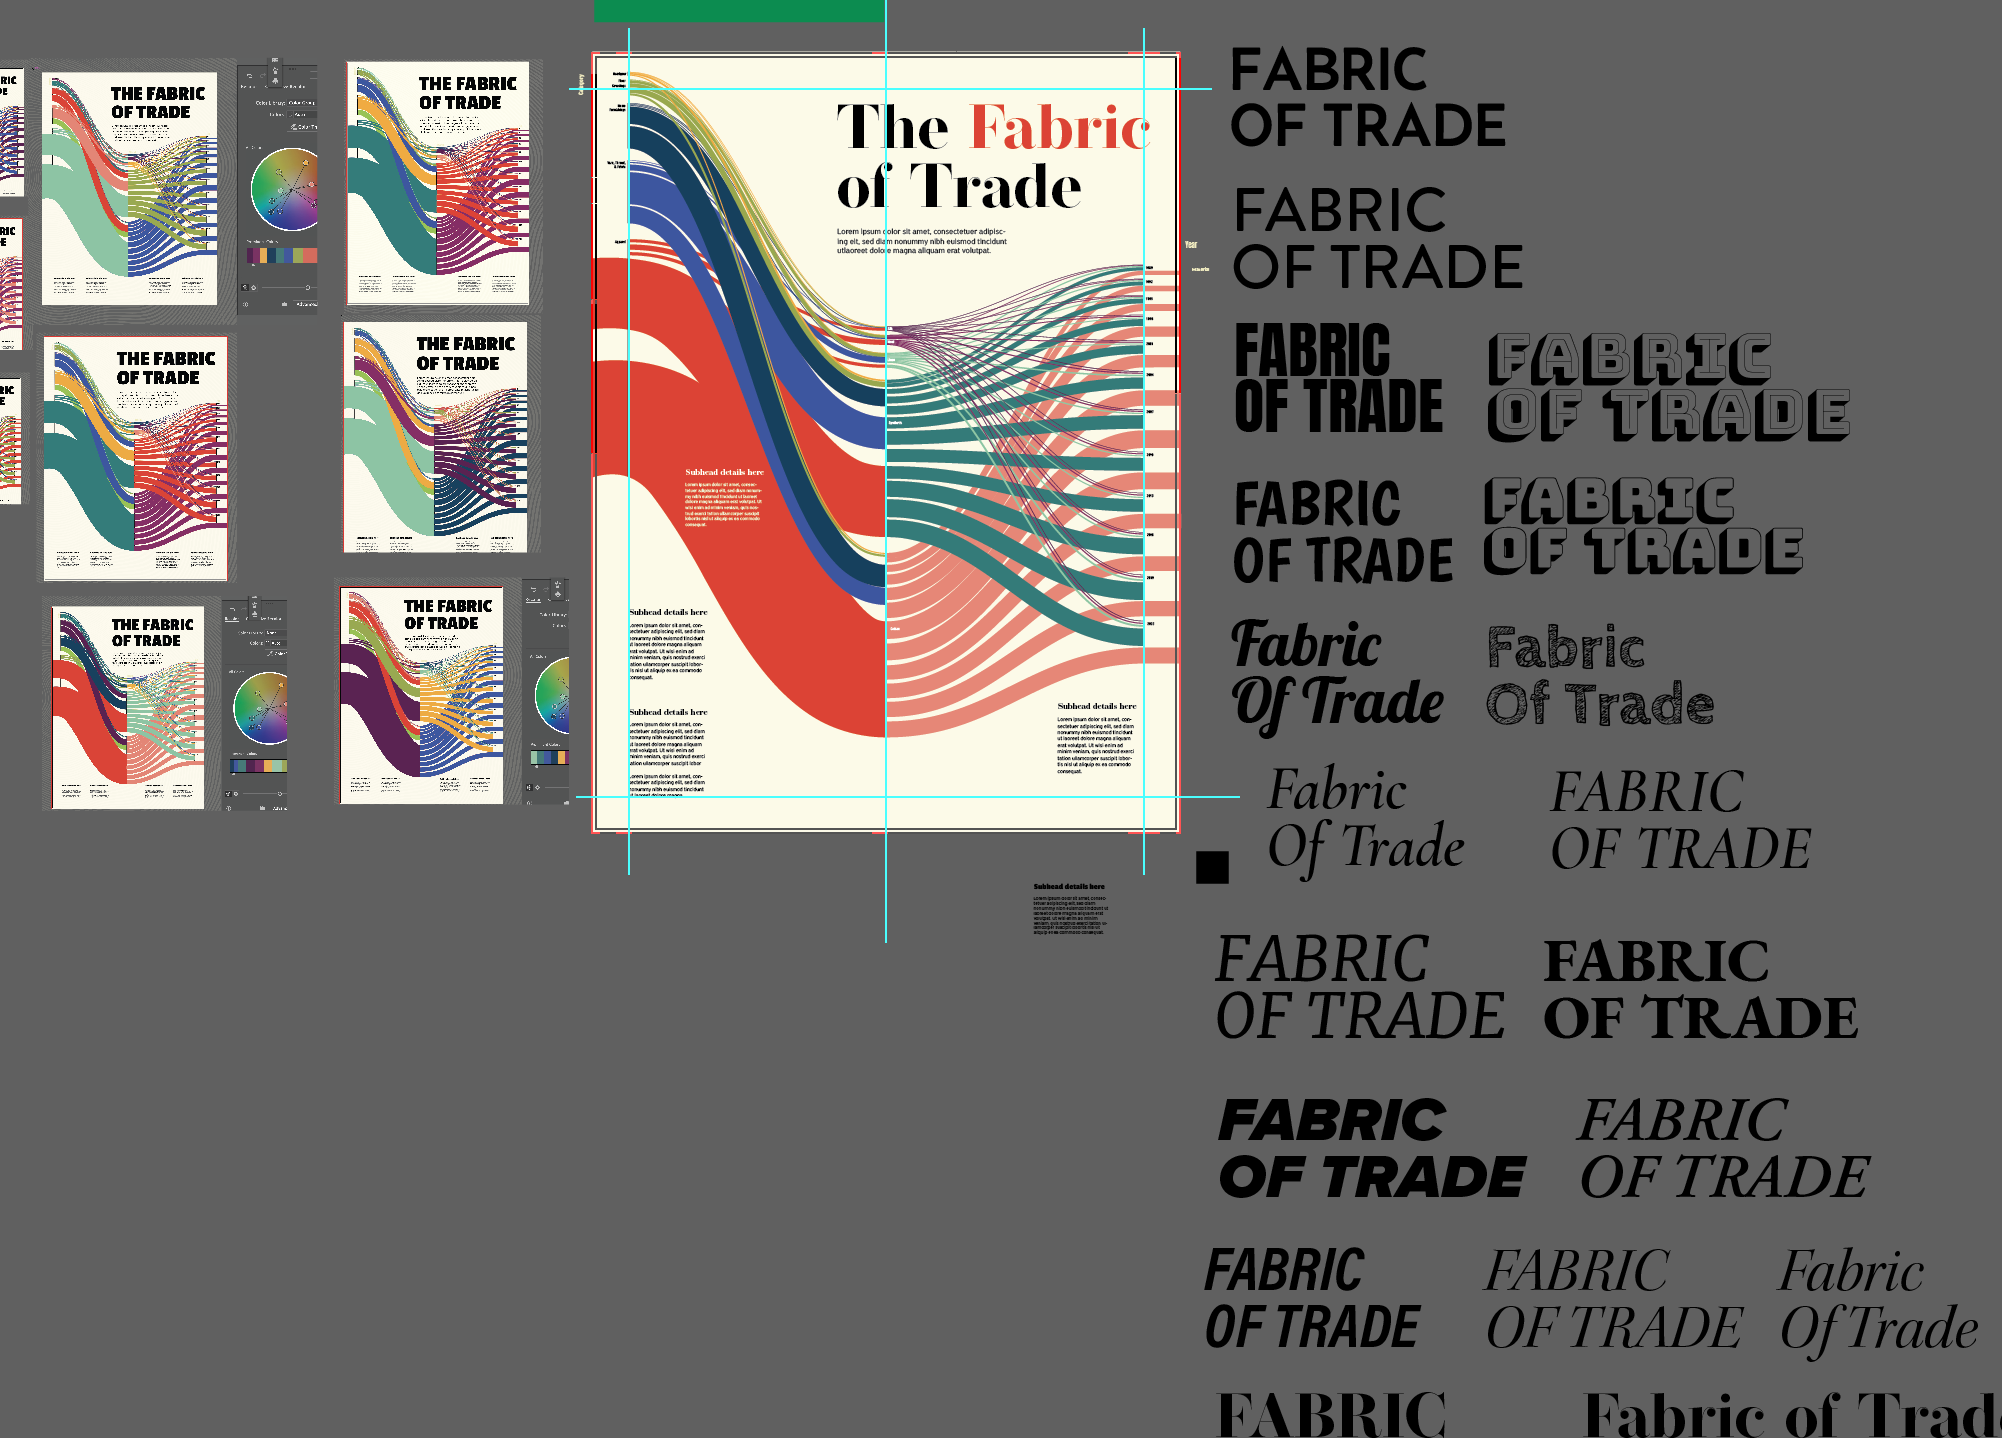
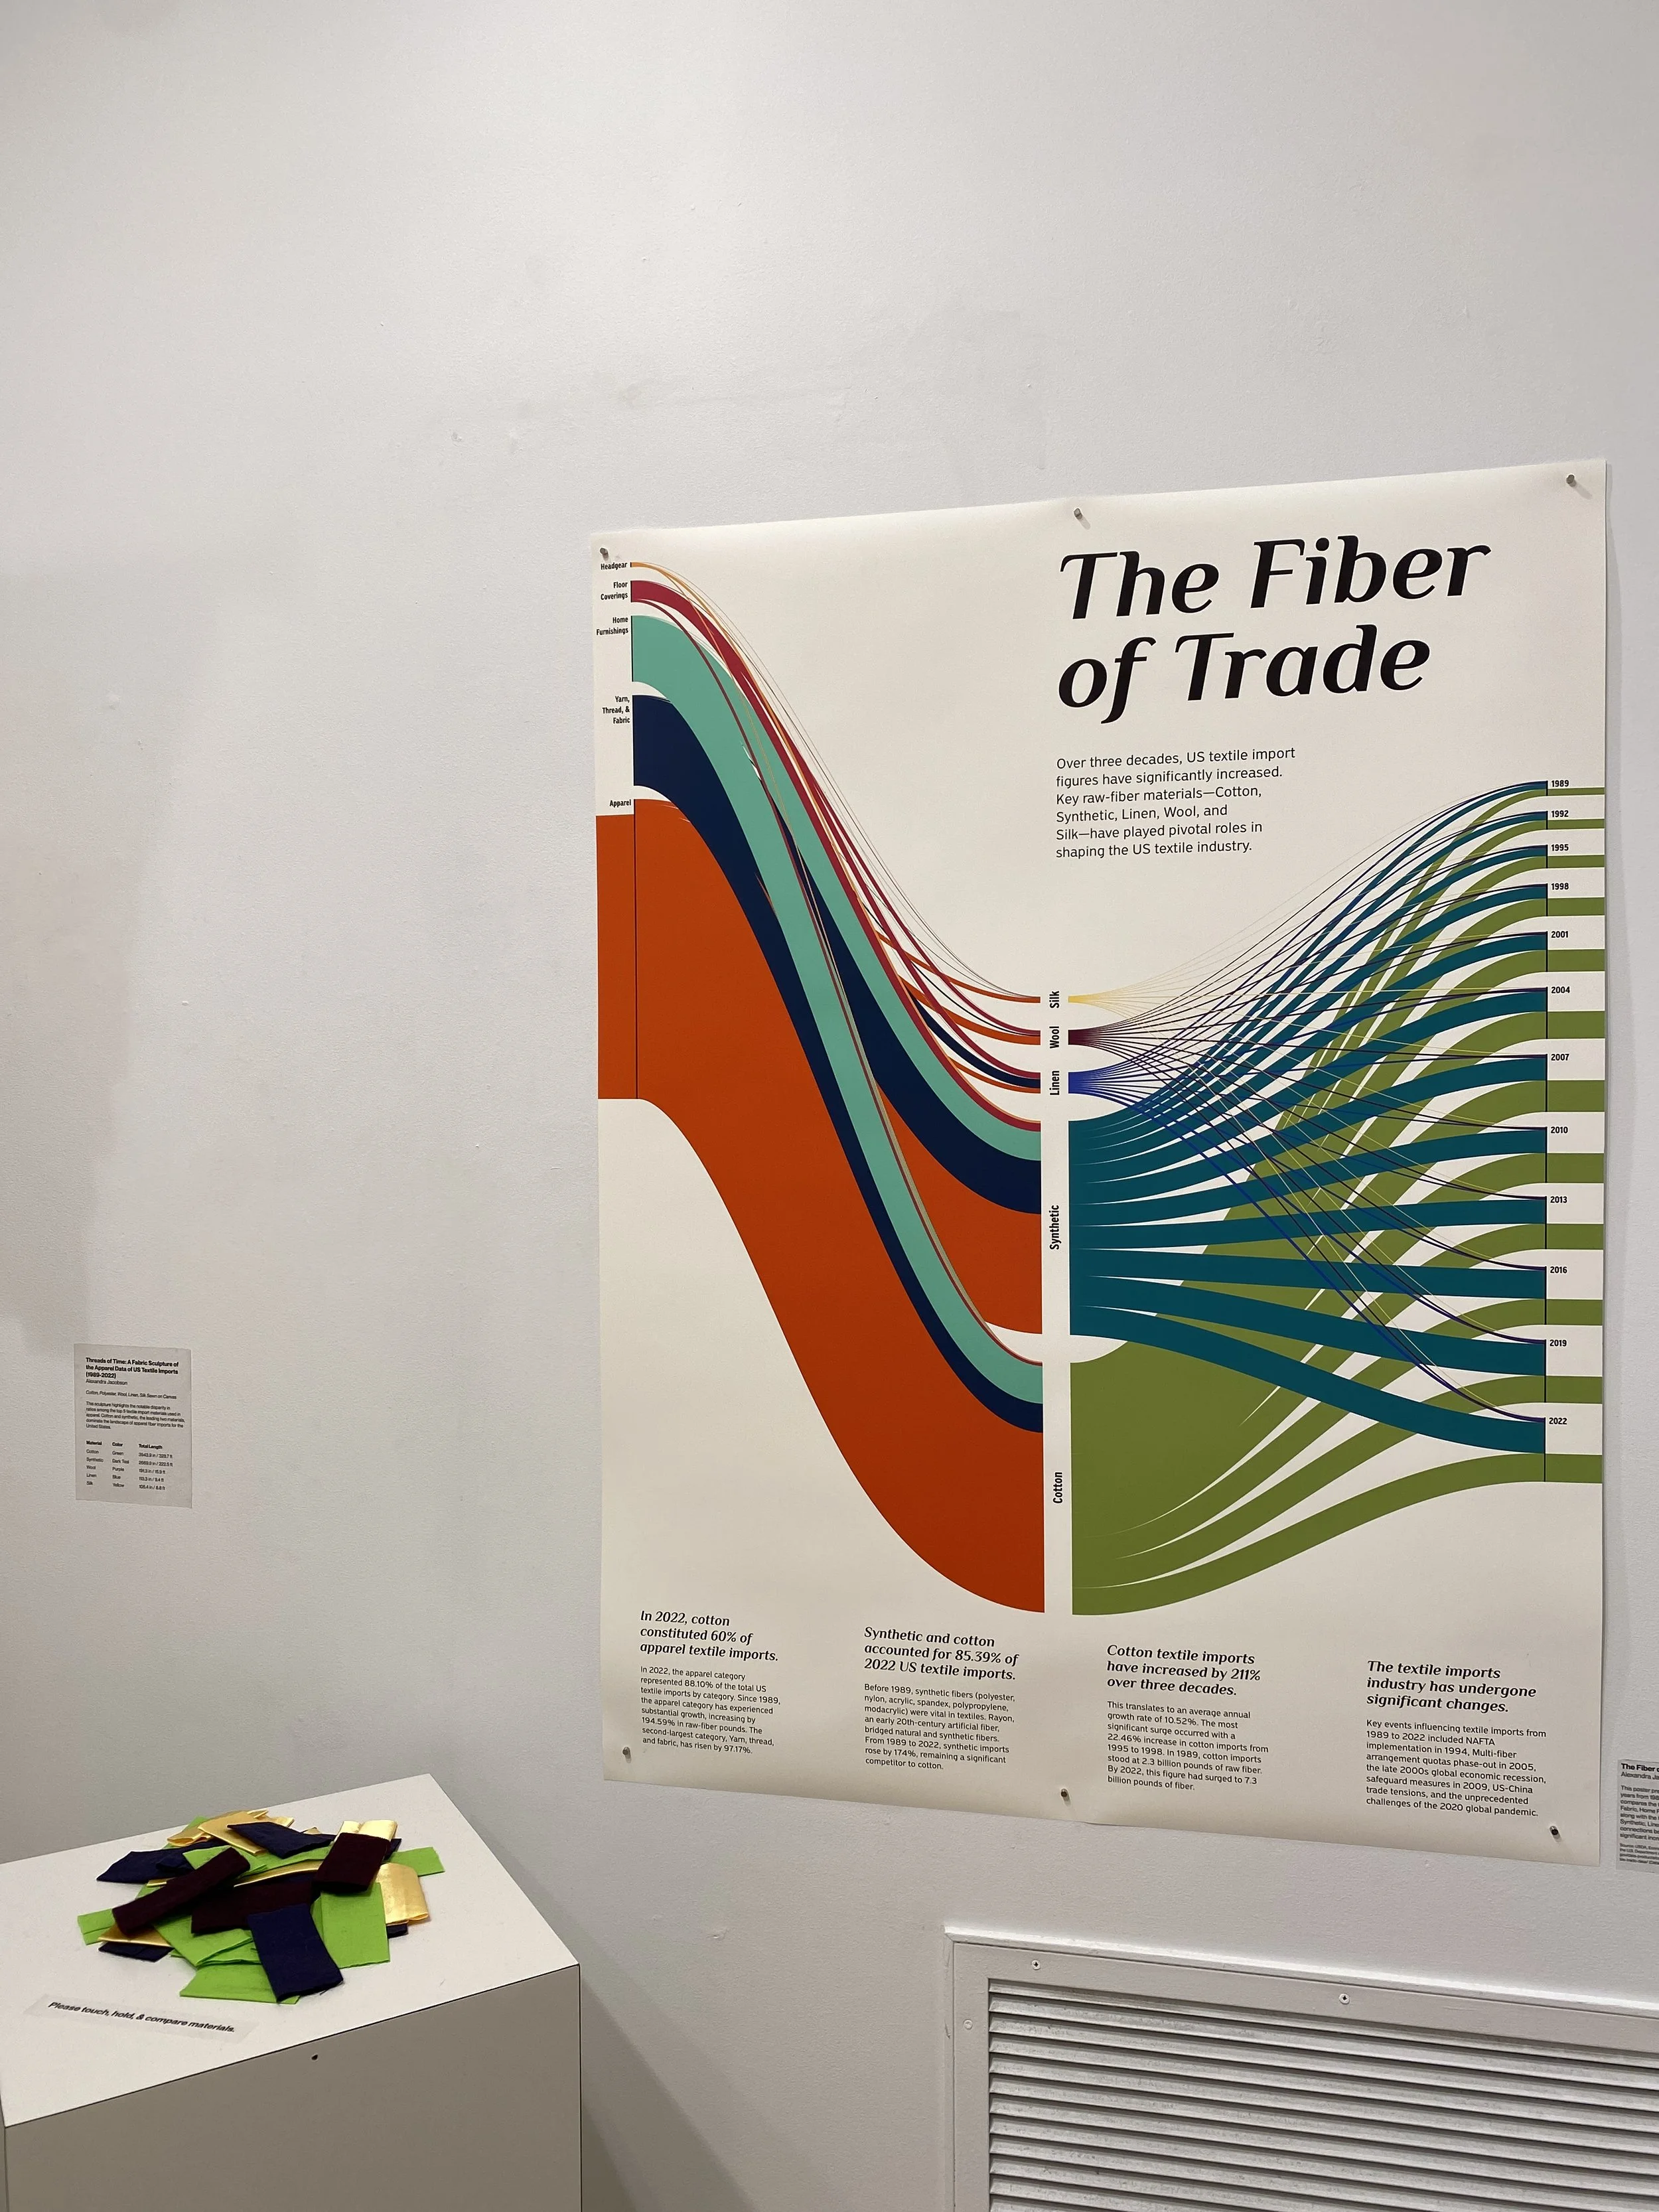
Visual Data Representation: Infographic of Textile Imports
The accompanying poster visually mapped US Textile Import data from 1989 to 2022, comparing the top five categories of imports—Apparel, Yarn, Thread & Fabric, Home Furnishings, Floor Coverings, and Headgear. It also highlighted the connections between these categories and the top five raw materials, providing a clear representation of the increases in textile imports over time. The visualizations allowed visitors to grasp the broader context of the apparel industry’s evolving landscape.
Material Dominance Highlight: Cotton & Synthetic Supremacy
Through both the sculpture and poster, the installation emphasized the dominance of cotton and synthetic materials, which have consistently led the market in fiber imports. This focus drew attention to the environmental and economic impacts of these fibers within the textile industry, fostering discussion among visitors.
Multi-Sensory Dialogue: Global Textile Impact
The interactive fabric sculpture encouraged participants to engage in conversations about the complexities of textile production and material usage. The multi-sensory approach facilitated deeper reflection on the global impact of textile imports and allowed for a more immersive understanding of the data.
Educational Impact: Engagement Through Tactile & Visual Learning
The combination of tactile exploration and visual data presentation provided an educational experience, helping visitors to connect with and better understand the data on textile imports. This dual approach made complex industry statistics more accessible and meaningful, enhancing the audience’s engagement with the topic.
Data Visualization & Awareness: Apparel Industry Usage
The installation succeeded in using both tactile and visual elements to raise awareness of the shifts in US textile imports over time. By presenting the data in a hands-on and visually compelling manner, the installation fostered a stronger connection between visitors and the data, while highlighting the broader implications of material usage in the apparel industry.
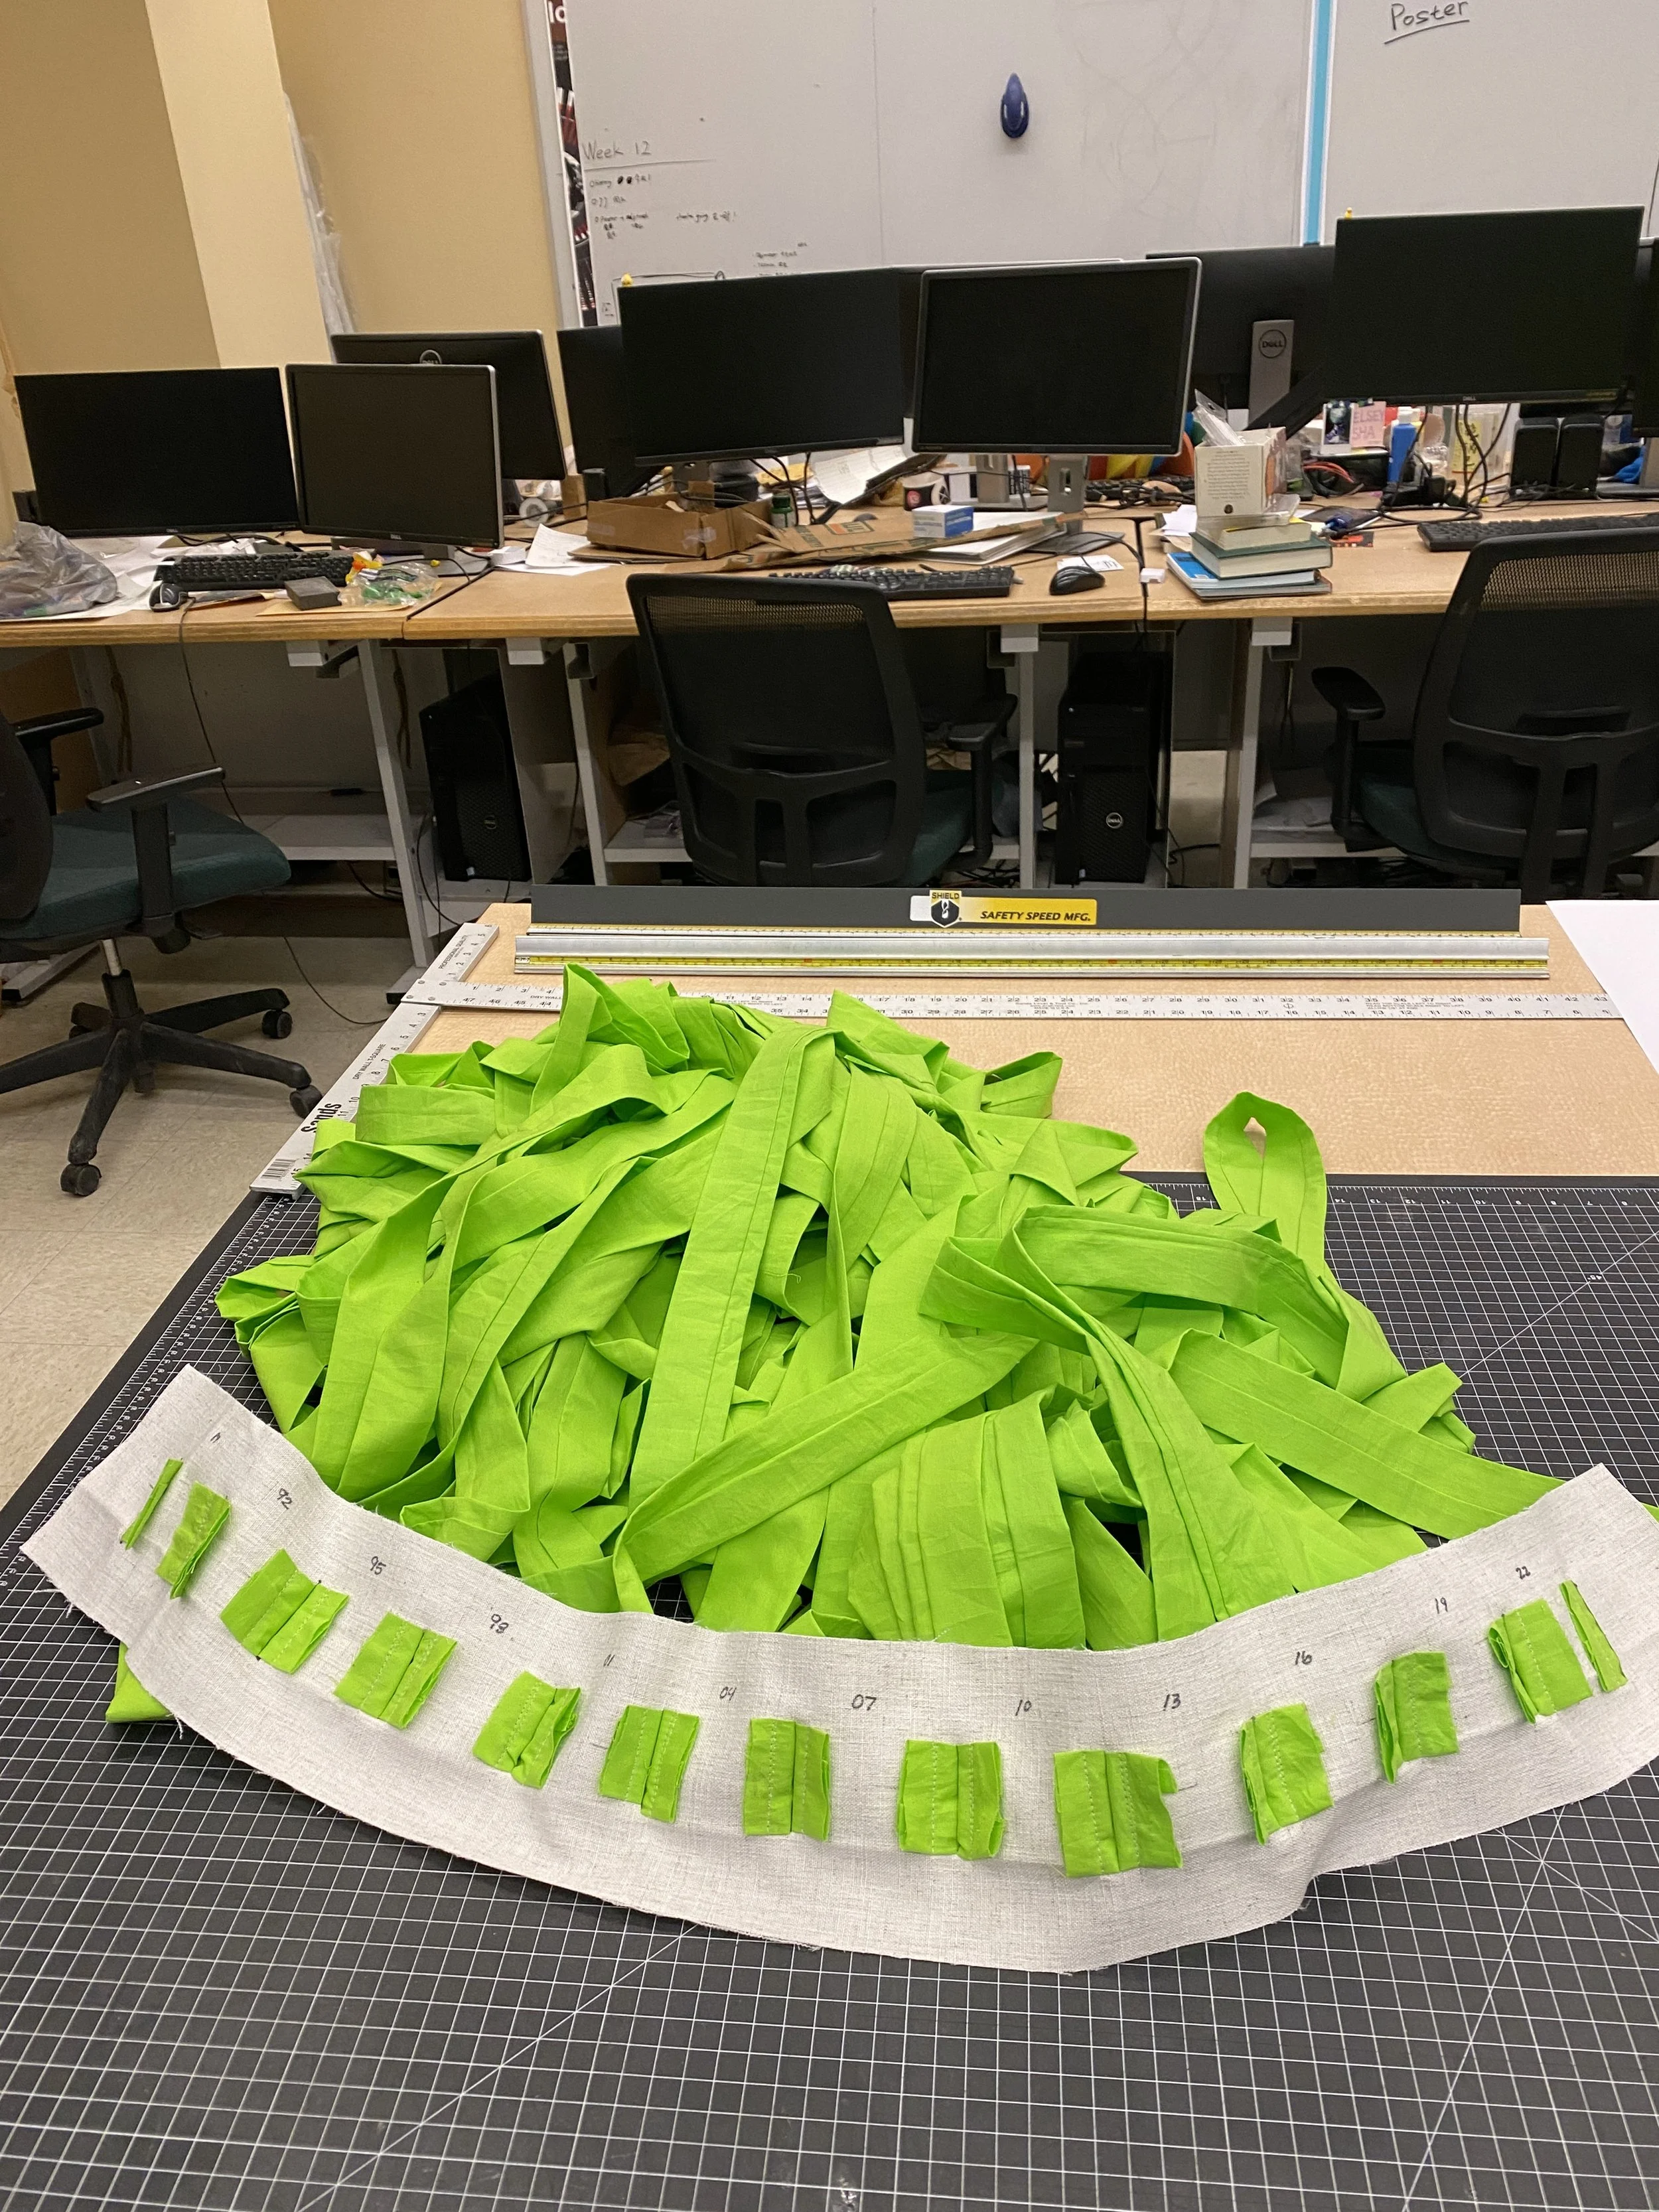
Behind the Scenes -